Author: Xu Chuanle, Jingdong Technology
background
Under high concurrency, the GC problem of Java programs is a very typical type of problem, and the impact will often be further amplified. Whether it is “GC frequency is too fast” or “GC time is too long”, due to the Stop The World problem during GC, it is easy to cause service timeout and cause performance problems.
At first, the problem was that a Full GC abnormality occurred in the garbage collection of an online application. In some instances of the application, the Full GC took a very long time, lasting about 15 to 30 seconds, and triggered once every 2 weeks or so on average;

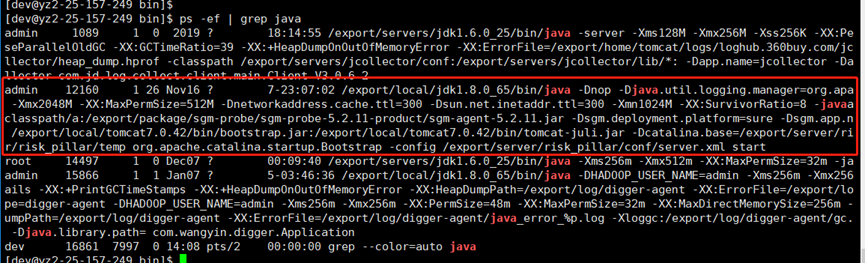
JVM parameter configuration “-Xms2048M –Xmx2048M –Xmn1024M –XX:MaxPermSize=512M”
Troubleshooting process
o Analyzing GC logs
The GC log records the execution time and execution result of each GC. By analyzing the GC log, you can tune the heap settings and GC settings, or improve the object allocation mode of the application.
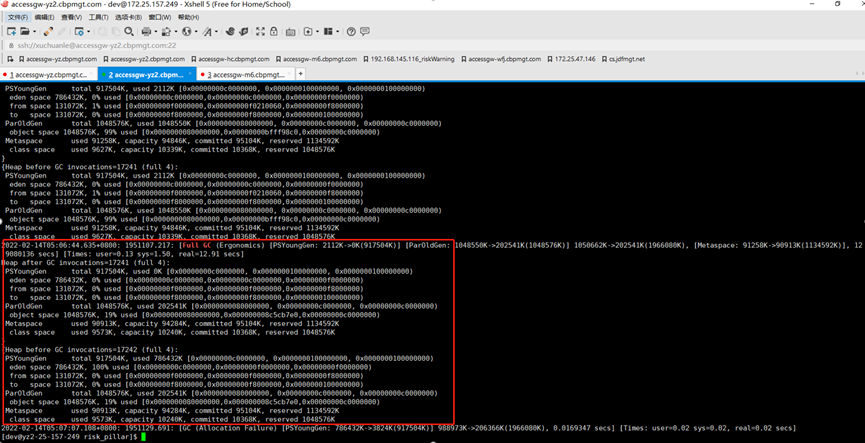
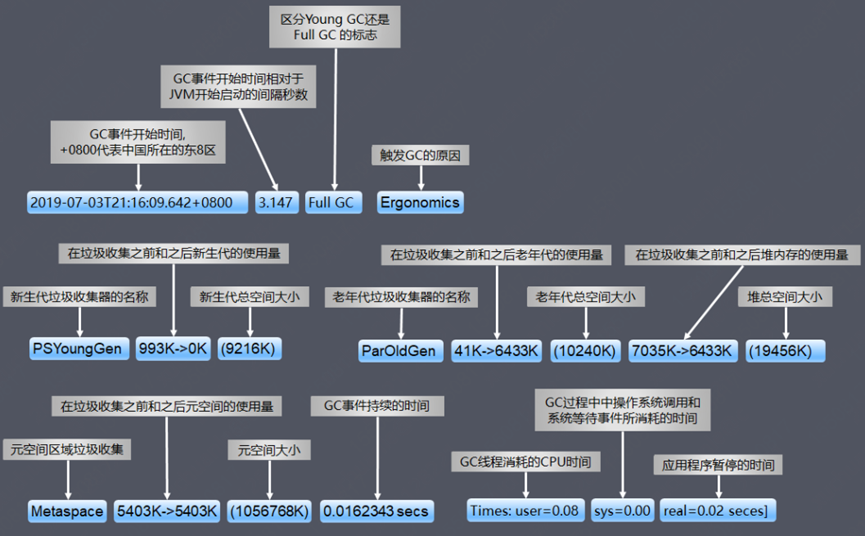
The reason for Full GC here is Ergonomics, because the UseAdaptiveSizePolicy is turned on, and the Full GC is caused by jvm’s self-adaptive adjustment.
This log mainly reflects the changes before and after the GC, so far I can’t see why.
To enable GC logging, you need to add the following JVM startup parameters:
-XX:+PrintGCDetails -XX:+PrintGCDateStamps -Xloggc:/export/log/risk_pillar/gc.log
Common Young GC, Full GC log meanings are as follows:
o Take a closer look at server performance metrics
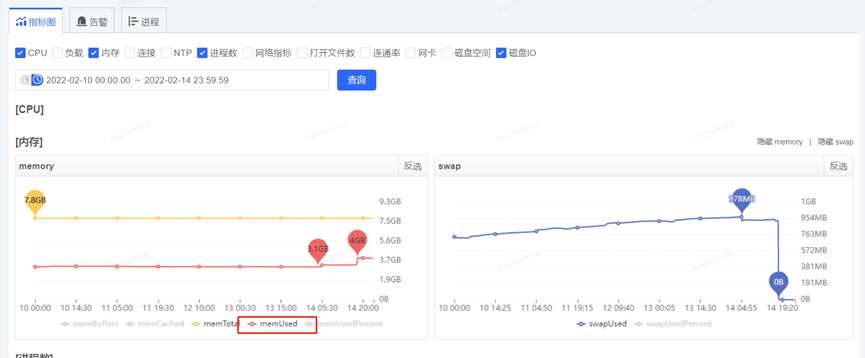
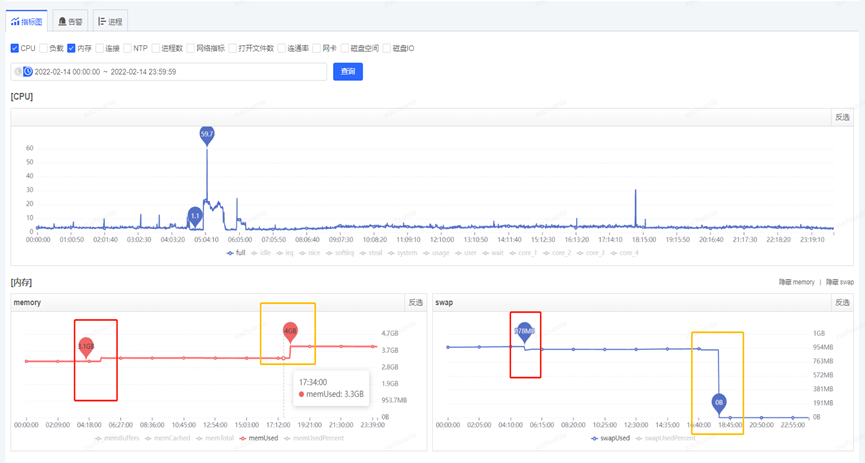
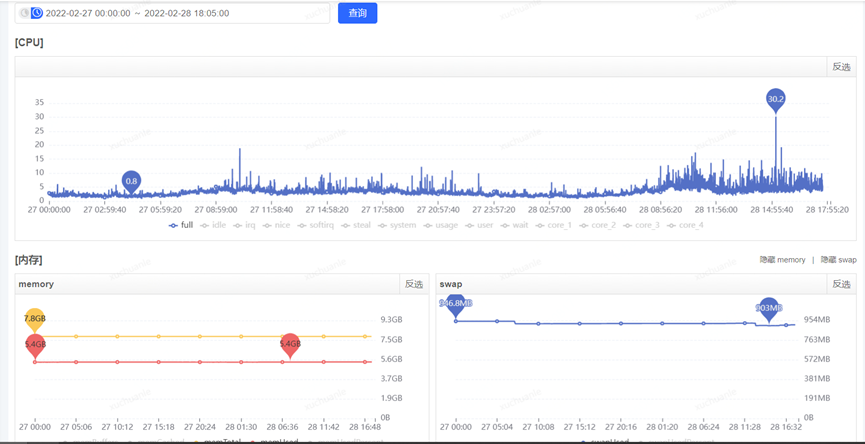
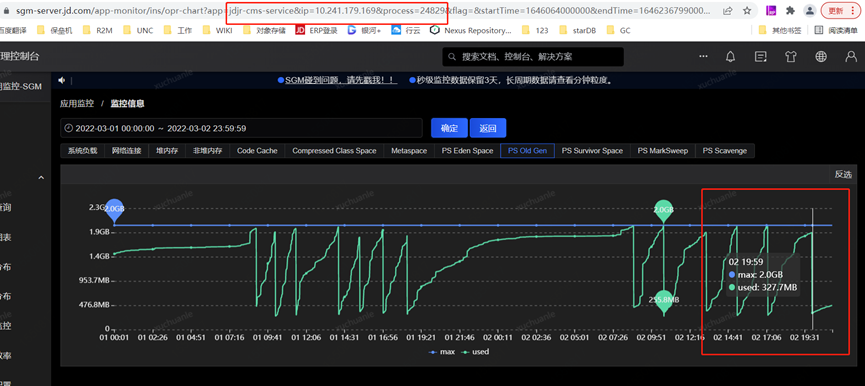
After obtaining the GC time-consuming time, obtain various monitoring items through the monitoring platform, and start to check the abnormal indicators at this time point. The final analysis found that at about 5.06 minutes (GC time point), the CPU usage increased significantly, while the SWAP There is an inflection point in the release of resources and the growth of memory resources (see the red box in the figure below for details. The change in the orange box is caused by modifying the configuration, which will be introduced later and can be ignored for the time being)
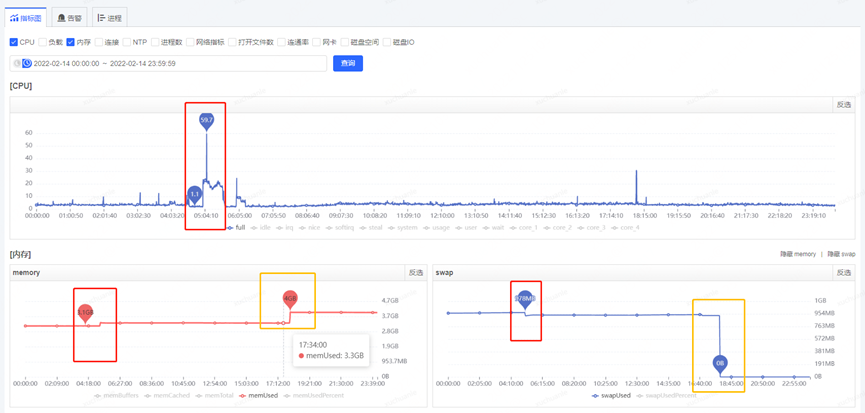
The JVM usesswap? Is it because the CPU suddenly soared due to GC, and the memory in the swap area was released to memory?
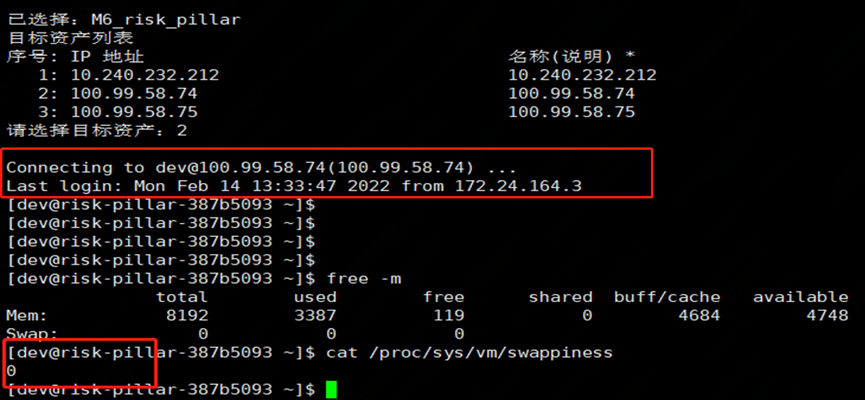
In order to verify whether the JVM uses swap, we check the memory resource usage of the process under proc
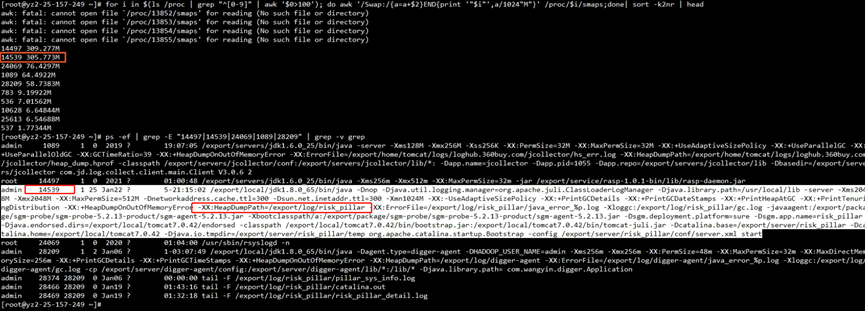
| for i in $( cd /proc;ls |grep “^[0-9]”|awk ‘ $0 >100’) ;do awk ‘/Swap:/{a=a+$2}END{print ‘”$i”‘,a/1024″M”}’ /proc/$i/smaps 2> /dev/null ; done | sort -k2nr | head -10 # head -10 means take out the top 10 processes with high memory usage # The first column taken out is the process id The second column process occupies the swap size | | — ————————————————– ————————————————– ————————————————– ————————————————– ————————- |
Seeing that 305MB of swap is indeed useful
Here is a brief introduction of what isswap?
Swap refers to a swap partition or file, which is mainly used to trigger memory recovery when there is pressure on memory usage. At this time, part of the memory data may be swapped to the swap space, so that the system will not cause oom or More deadly situations emerged.
When a process requests memory from the OS and finds that the memory is insufficient, the OS will swap out the temporarily unused data in the memory and put it in the swap partition. This process is called swap out.
When a process needs these data again and the OS finds that there is still free physical memory, it will exchange the data in the swap partition back to the physical memory. This process is called swap in.
In order to verify that the GC time-consuming is necessarily related to the swap operation, I randomly checked more than a dozen machines, focusing on the time-consuming GC logs, and confirmed that the GC time-consuming time point and the swap operation time point are indeed consistent through the time point.
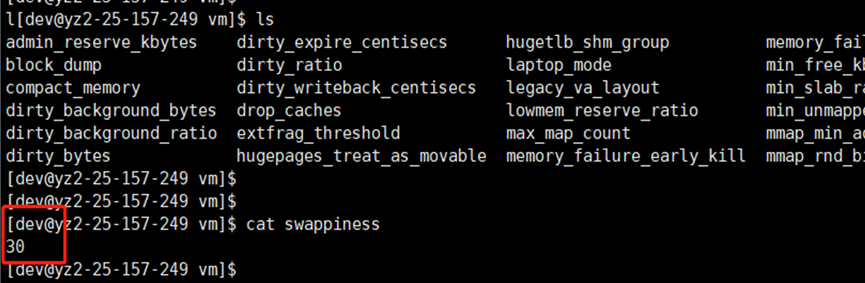
Further check the swappiness parameters of each instance of the virtual machine, a common phenomenon is that all instances with a long Full GC are configured with the parameter vm.swappiness = 30 (the larger the value, the more inclined to use swap); while the instance with relatively normal GC time The configuration parameter vm.swappiness = 0 (minimizes the use of swap).
swappiness can be set to a value between 0 and 100. It is a kernel parameter of Linux that controls the relative weight of memory usage when the system performs swap.
Ø swappiness=0: Indicates the maximum use of physical memory, and then the swap space
Ø swappiness=100: indicates that the swap partition is actively used, and the data on the memory is swapped to the swap space in time
The corresponding physical memory usage and swap usage are as follows
So far, the finger seems to be pointing at swap.
o problem analysis
When the memory usage reaches the watermark (vm.swappiness), Linux will put some temporarily unused memory data into the disk swap to free up more available memory space;
When the data located in the swap area needs to be used, it is then swapped back into the memory. When the JVM performs GC, it needs to traverse the used memory of the corresponding heap partition;
If a part of the heap is swapped to the swap space during the GC, it needs to be swapped back to the memory when traversing this part. Because it needs to access the disk, its speed is definitely slower than the physical memory. Point out, the GC pause time will be very, very scary;
In turn, it leads to a lag in Linux’s recovery of the swap partition (swapping in and out from memory to disk takes up CPU and system IO). In high concurrency/QPS services, the result of this lag is fatal (STW).
o problem solved
So far, the answer seems to be very clear, we just need to try to close or release the swap to see if it can solve the problem?
How to release swap?
- Set vm.swappiness=0 (it will take effect after restarting the application to release swap), which means that the swap memory should not be used as much as possible
a. The temporary setting scheme will not take effect after restarting
sysctl vm.swappiness=0
cat /proc/sys/vm/swappiness
b. The permanent setting scheme will still take effect after restarting
vi /etc/sysctl.conf
vm.swappiness=0
- Close the swap partition swapoff -a
Premise: First, ensure that the remaining memory is greater than or equal to the swap usage, otherwise it will report Cannot allocate memory! Once the swap partition is released, all files stored in the swap partition will be transferred to physical memory, which may cause system IO or other problems.
a. Check where the current swap partition is mounted?

b. Shut down the partition
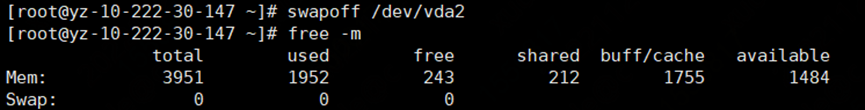
The memory change after closing the swap area is shown in the orange box in the figure below. At this time, the files in the swap partition are all transferred to the physical memory.
After closing the Swap area, Full GC occurred again on 2.23, which took 190ms, and the problem was solved.
o Confuse
1. Does the GC take a long time as long as the JVM in the swap area is enabled?
2. Since the JVM doesn’t like swap so much, why doesn’t the JVM explicitly prohibit its use?
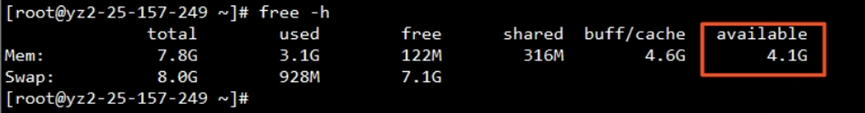
3. What is the working mechanism of swap? This server with a physical memory of 8G uses swap memory (swap), indicating that the physical memory is not enough. However, if you check the memory usage through the free command, the actual physical memory does not seem to take up that much, but Swap has accounted for nearly 1G. ?
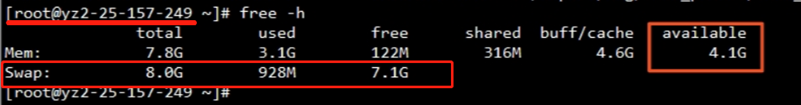
free: How much memory is left except buff/cache
shared: shared memory
buff/cache: the number of memory in the buffer and cache area (usually the program frequently accesses files if the usage is too high)
available: the real remaining available memory
You can think about it, what does it mean to turn off the swap disk cache?
In fact, there is no need to be so radical. You must know that this world is never either 0 or 1. Everyone will choose to be in the middle more or less, but some are biased towards 0 and some are biased towards 1.
Obviously, on the issue of swap, the JVM can choose to use as little as possible to reduce the impact of swap. To reduce the impact of swap, it is necessary to figure out how Linux memory recovery works, so as not to miss any possible doubts.
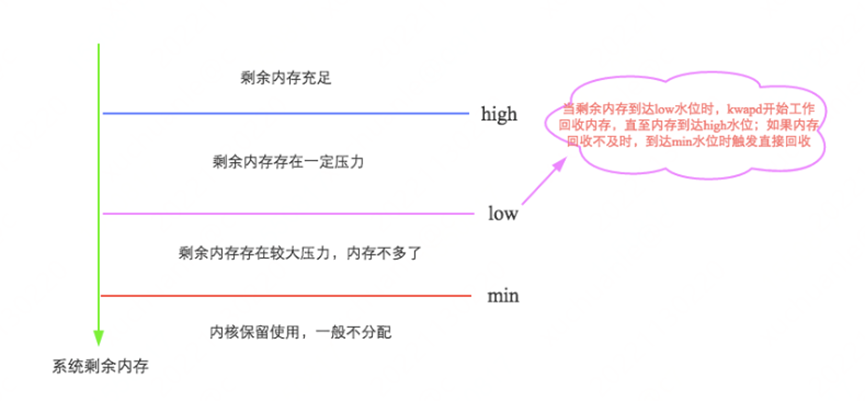
Let’s first take a look at how swap is triggered?
Linux will trigger memory reclamation in two scenarios, one is to trigger memory reclamation immediately when it finds that there is not enough free memory during memory allocation; the other is to start a daemon process (kswapd process) to periodically check the system memory , to proactively trigger memory reclamation after free memory drops below a certain threshold.
It can be easily understood by the following diagram. For details, see: http://hbasefly.com/2017/05/24/hbase-linux/
The answer is that as long as the JVM in the swap area is turned on, the GC will take a long time
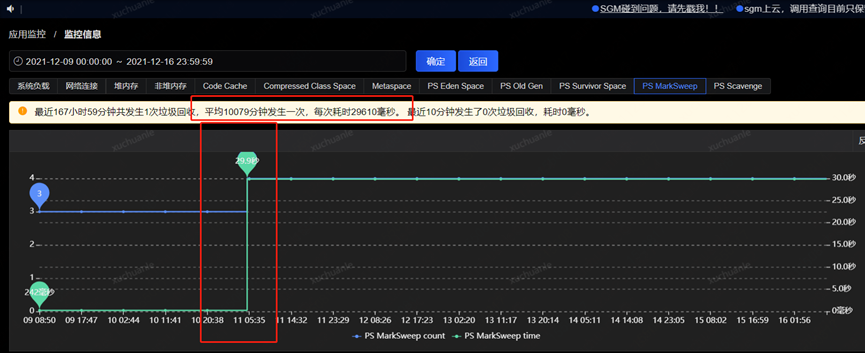
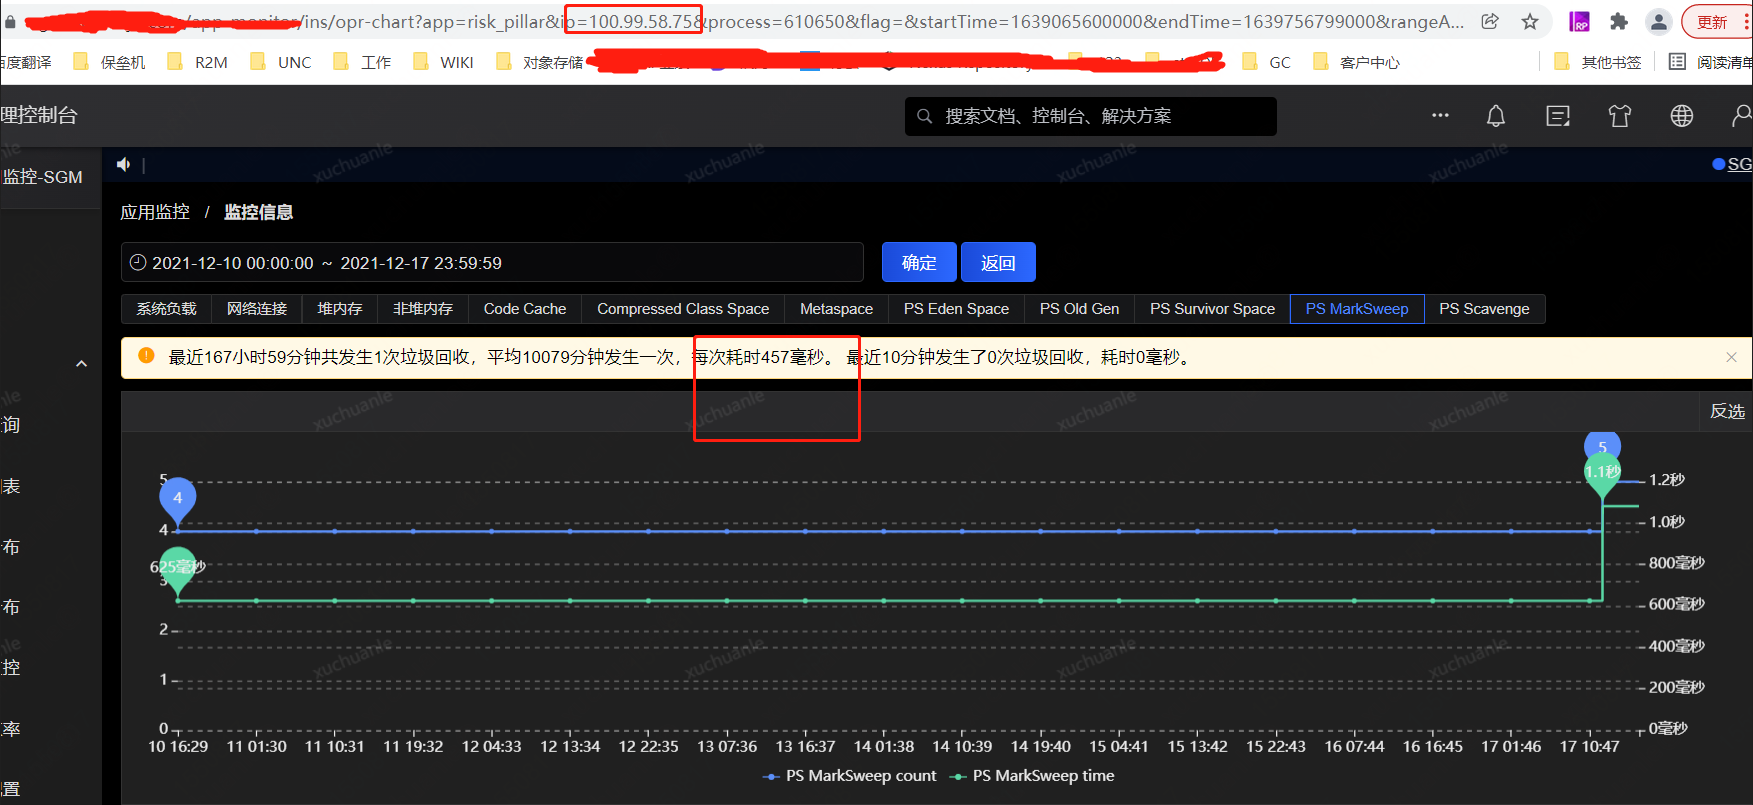
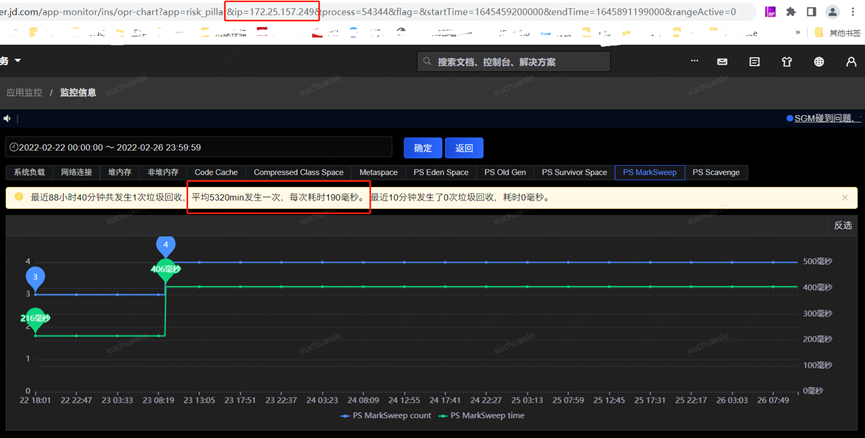
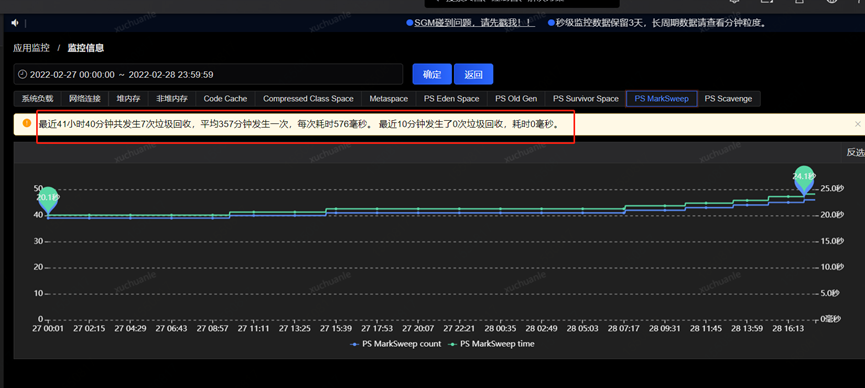
The author checked another application, and the relevant indicator information is shown in the figure below.
The QPS of the real-name service is very high. It can also be seen that the swap is applied, and the GC takes an average of 576ms. Why is this?
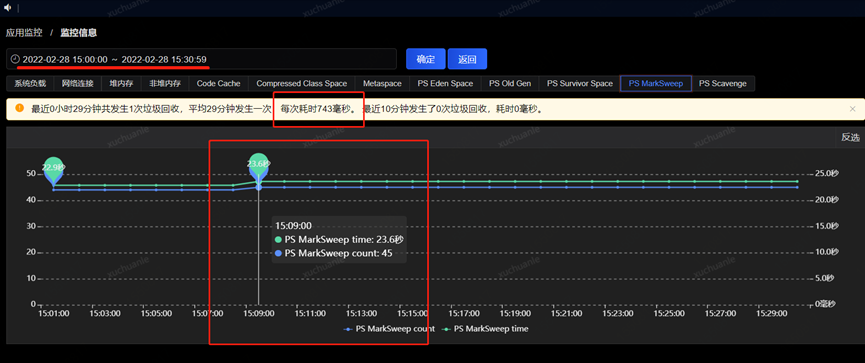
By focusing the time range on a certain time period when GC occurs, it can be seen from the monitoring index graph that there is no change in swapUsed, that is to say, there is no swap activity, which does not affect the total time spent on garbage collection.

Use the following command to list the swap space occupied by each process, and it is clear that the real name service occupies less swap space (only 54.2MB)

Another notable phenomenon is that the Full GC interval of the real-name service is short (every few hours), while my service has a Full GC interval of 2 weeks on average.
Based on the above speculation
1. Due to the short GC interval of the real-name service, the things in the memory have no chance to be replaced into the swap before being recycled. During the GC, the data in the swap partition does not need to be swapped back to the physical memory, which is completely based on memory calculation, so much faster
2. The screening strategy for replacing which memory data into the swap area should be similar to the LRU algorithm (least recently used principle)
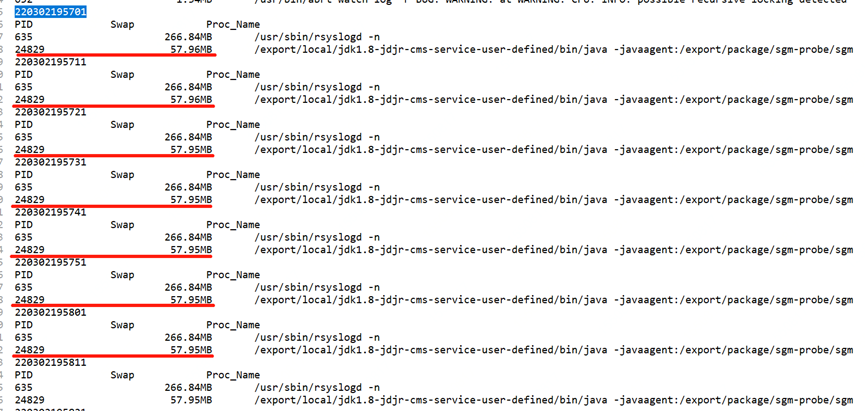
In order to confirm the above speculation, we only need to track the swap change log and monitor the data changes to get the answer. Here we use a shell script to achieve
#!/bin/bash
echo -e `date +%y%m%d%H%M%S`
echo -e "PID\t\tSwap\t\tProc_Name"

#拿出/proc目录下所有以数字为名的目录(进程名是数字才是进程,其他如sys,net等存放的是其他信息)
for pid in `ls -l /proc | grep ^d | awk '{ print $9 }'| grep -v [^0-9]`
do
    if [ $pid -eq 1 ];then continue;fi
    grep -q "Swap" /proc/$pid/smaps 2>/dev/null
    if [ $? -eq 0 ];then
        swap=$(gawk '/Swap/{ sum+=$2;} END{ print sum }' /proc/$pid/smaps) #统计占用的swap分区的 大小 单位是KB
        proc_name=$(ps aux | grep -w "$pid" | awk '!/grep/{ for(i=11;i<=NF;i++){ printf("%s ",$i); }}') #取出进程的名字
        if [ $swap -gt 0 ];then #判断是否占用swap 只有占用才会输出
            echo -e "${pid}\t${swap}\t${proc_name:0:100}"
    fi
   fi
done | sort -k2nr | head -10 | gawk -F'\t' '{ #排序取前 10
    pid[NR]=$1;
    size[NR]=$2;
    name[NR]=$3;
}
END{
    for(id=1;id<=length(pid);id++)
    {
    if(size[id]<1024)
        printf("%-10s\t%15sKB\t%s\n",pid[id],size[id],name[id]);
    else if(size[id]<1048576)
        printf("%-10s\t%15.2fMB\t%s\n",pid[id],size[id]/1024,name[id]);
    else
    printf("%-10s\t%15.2fGB\t%s\n",pid[id],size[id]/1048576,name[id]);
    }
}'
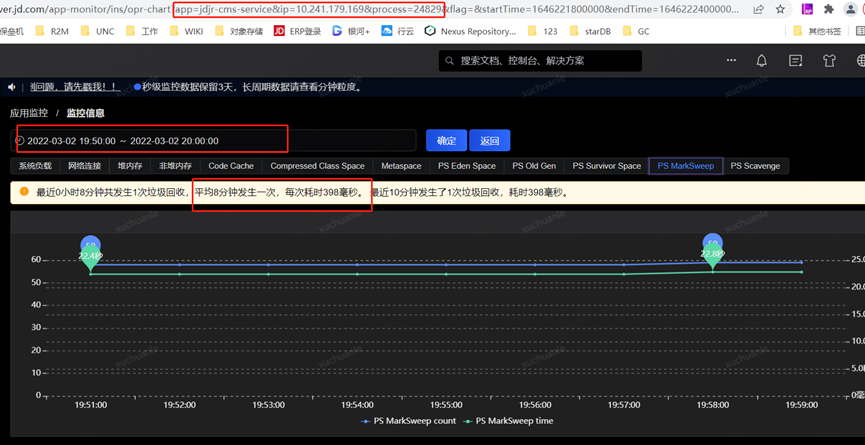
Since a Full GC occurred from 2022.3.2 19:57:00 to 2022.3.2 19:58:00 in the above figure, we can focus on the changes in the swap area within this minute. I will make information every 10s here Collection, you can see that the swap does not change before and after the GC time point
Through the above analysis, returning to the core issue of this article, it seems that my processing method is too radical. In fact, the problem can also be solved by appropriately reducing the heap size without closing swap.
This also shows that the Linux system that deploys Java services is not brainless and comprehensive in terms of memory allocation. It needs to comprehensively consider the JVM’s impact on Java permanent generation, Java heap (new generation and old generation), thread stack, Memory requirements used by Java NIO.
Summarize
To sum up, we conclude that if swap and GC occur at the same time, the GC time will be very long, the JVM will freeze severely, and in extreme cases, the service will crash.
The main reason is: when the JVM performs GC, it needs to traverse the used memory of the corresponding heap partition. If a part of the heap is swapped to swap during GC, it needs to be swapped back to memory when this part is traversed. ;In more extreme cases, due to insufficient memory space at the same time, another part of the heap in the memory needs to be changed to SWAP. Therefore, in the process of traversing the heap partition, the entire heap partition will be written to SWAP in turn, resulting in excessive GC time. long. The size of the swap area should be limited online. If the ratio of swap usage is high, it should be checked and resolved. When appropriate, you can reduce the heap size or add physical memory.
Therefore, Linux systems deploying Java services must be cautious in memory allocation.
I hope the above content can play a role in turning around and attracting jade. If there is something that is not well understood, please point it out.
#JVM #long #pause #troubleshooting #process #Cloud #Developers #personal #space #News Fast Delivery