Author: Yushan, Shimian
In the microservice architecture, the dependencies between services are intricate, and we often use load balancing components to cooperate with the registry to realize the perception between services. This perception behavior requires the cooperation of the caller, the load balancing component, the registry, and the callee to achieve it. When a problem occurs, it may be difficult for us to determine which part of the problem is. In normal scenarios, the registry will have The corresponding console can be viewed, and the caller, load balancing component, and callee need to manually add log print statements and restart the application to get relevant information, and some components are difficult to find a suitable place to add our log code. This makes the troubleshooting of such problems inefficient.
Analysis of load balancing principle
Let’s take the Spring Cloud application as an example to analyze, what exactly is microservice load balancing?
The demo in this article includes four applications, log-demo-spring-cloud-zuul, log-demo-spring-cloud-a, log-demo-spring-cloud-b, and log-demo-spring-cloud-c, which are the easiest to use. The standard usage of Spring Cloud is called in turn, and you can view the source code directly on the project:
https://github.com/aliyun/alibabacloud-microservice-demo/tree/master/mse-simple-demo
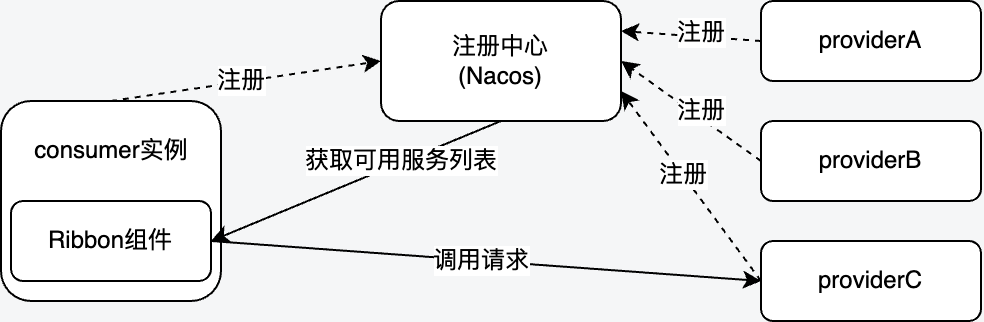
Taking Ribbon, a commonly used client load balancing component of Spring Cloud as an example, its working principle is shown in the following figure.

Ribbon is located on the client side, and obtains a list of available services provided by the server through the service registry (Nacos in this article). Then, when the client sends a request, a server instance is selected through the load balancing algorithm and then accessed to achieve the purpose of load balancing. In this process, in order to perceive the changes in the list of available services in the service registry, Ribbon will start a timed thread to cyclically call the com.netflix.loadbalancer.DynamicServerListLoadBalancer#updateListOfServers method when constructing com.netflix.loadbalancer.DynamicServerListLoadBalancer to update its own holdings list of available services.
  @VisibleForTesting
    public void updateListOfServers() {
        List<T> servers = new ArrayList<T>();
        if (serverListImpl != null) {
      //从注册中心获取可用服务列表
            servers = serverListImpl.getUpdatedListOfServers();
            LOGGER.debug("List of Servers for {} obtained from Discovery client: {}",
                    getIdentifier(), servers);

            if (filter != null) {
        //根据加载的过滤器过滤地址
                servers = filter.getFilteredListOfServers(servers);
                LOGGER.debug("Filtered List of Servers for {} obtained from Discovery client: {}",
                        getIdentifier(), servers);
            }
        }
    //更新可用服务列表
        updateAllServerList(servers);
    }
It can be found from the code that the parameter servers of the updateAllServerList(servers) method is the list of available services after the update, but in order to ensure the real scene, we continue down the call chain.
  protected void updateAllServerList(List<T> ls) {
        // other threads might be doing this - in which case, we pass
        if (serverListUpdateInProgress.compareAndSet(false, true)) {
            try {
                for (T s : ls) {
                    s.setAlive(true); // set so that clients can start using these
                                      // servers right away instead
                                      // of having to wait out the ping cycle.
                }
                setServersList(ls);
                super.forceQuickPing();
            } finally {
                serverListUpdateInProgress.set(false);
            }
        }
    }
It can be seen that only one thread can call the setServersList(ls) method to update the list of available services, and the subsequent call chain has some processing logic.
com.netflix.loadbalancer.DynamicServerListLoadBalancer#updateAllServerList
  -> com.netflix.loadbalancer.DynamicServerListLoadBalancer#setServersList
  -> com.netflix.loadbalancer.DynamicServerListLoadBalancer#setServerListForZones
  -> com.netflix.loadbalancer.LoadBalancerStats#updateZoneServerMapping
The parameters Map
Non-intrusive Microservice Insights
Can we provide a capability that we can dynamically print the required logs at key positions in any code, and observe any part of the current real scene, so as to assist us in troubleshooting. Considering the complexity of distributed microservice applications, this capability requires some of the following characteristics:
Distributed features: In a distributed scenario, even in a complex microservice architecture, this capability requires the ability to open up microservice links, log adjustment, traffic condition matching, and upstream and downstream linkages in a series of distributed scenarios.
Non-invasive feature: No need to restart the application, dynamic enhancement and uninstallation, the entire application or any node can be dynamically enhanced.
Full Field Retention Capability: The captured on-site context and other information can be automatically retained in the remote log system.
flexible rules set: It can flexibly match any traffic, enhance any method point, and flexibly control the required reserved context content.
Based on the above thinking, we provide non-intrusive micro-service insight capabilities, which can quickly help us solve the positioning and diagnosis of complex problems in micro-service scenarios, provide ideas and help for our governance, and help enterprises build complete microservice governance system.
Insight into the loadbalancer restore service to discover the first scene
Let’s take a look at how to solve the microservice load balancing ability?
With the help of Microservice Insights, we will save the field where the print target method contains the parameters at the location we found. We first select the log-demo-spring-cloud-a application, select the custom buried point in the interface list, and fill in the target class and target method we determined.
Target class: com.netflix.loadbalancer.LoadBalancerStats Target method: updateZoneServerMapping(java.util.Map)

Since no filter condition is required in this scenario, the traffic filter condition part can be kept off by default. In the print content section, since the content we are concerned about is the input parameters of this method, check the request parameters in the general classification, and the other options can be checked according to the needs.

Select all or specified instances of the target instance according to actual needs, and finally open the rule and click OK.
Observe service discovery results
After completing the above configuration, we can view the collected logs in the corresponding SLS LogStore, the structure of which is roughly as follows.
appName:log-demo-spring-cloud-a
destinationEndpoint:
end:1662541729796
endpoint:10.0.0.24
hostname:log-demo-spring-cloud-a-58b8b7ccc9-gnmsv
interface:com.netflix.loadbalancer.LoadBalancerStats:updateZoneServerMapping(java.util.Map)
ip:10.0.0.24
parameters:[{"unknown":[{"alive":true,"host":"10.0.0.125","hostPort":"10.0.0.125:20002","id":"10.0.0.125:20002","instance":{"clusterName":"DEFAULT","enabled":true,"ephemeral":true,"healthy":true,"instanceHeartBeatInterval":5000,"instanceHeartBeatTimeOut":15000,"instanceId":"10.0.0.125#20002#DEFAULT#DEFAULT_GROUP@@sc-B","ip":"10.0.0.125","ipDeleteTimeout":30000,"metadata":{"__micro.service.app.id__":"hkhon1po62@622bd5a9ab6ab48","preserved.register.source":"SPRING_CLOUD"},"port":20002,"serviceName":"DEFAULT_GROUP@@sc-B","weight":1.0},"metaInfo":{"appName":"DEFAULT_GROUP@@sc-B","instanceId":"10.0.0.125#20002#DEFAULT#DEFAULT_GROUP@@sc-B"},"metadata":{"$ref":"$[0].unknown[0].instance.metadata"},"port":20002,"readyToServe":true,"zone":"UNKNOWN"},{"alive":true,"host":"10.0.0.52","hostPort":"10.0.0.52:20002","id":"10.0.0.52:20002","instance":{"clusterName":"DEFAULT","enabled":true,"ephemeral":true,"healthy":true,"instanceHeartBeatInterval":5000,"instanceHeartBeatTimeOut":15000,"instanceId":"10.0.0.52#200...展开
parentSpanID:-1
ruleName:[237]
serviceType:DYNAMIC
spanID:4096
start:1662541729795
success:true
tag:_base
traceID:ea1a00001816625413997651001d0001
userId:1784327288677274
The parameters part is the input parameter packaged in JSON format. After formatting it, you can see that this is the list of available services we want to get.
[
    {
        "unknown": [
            {
                "alive": true,
                "host": "10.0.0.125",
                "hostPort": "10.0.0.125:20002",
                "id": "10.0.0.125:20002",
                "instance": {
                    "clusterName": "DEFAULT",
                    "enabled": true,
                    "ephemeral": true,
                    "healthy": true,
                    "instanceHeartBeatInterval": 5000,
                    "instanceHeartBeatTimeOut": 15000,
                    "instanceId": "10.0.0.125#20002#DEFAULT#DEFAULT_GROUP@@sc-B",
                    "ip": "10.0.0.125",
                    "ipDeleteTimeout": 30000,
                    "metadata": {
                        "__micro.service.app.id__": "hkhon1po62@622bd5a9ab6ab48",
                        "preserved.register.source": "SPRING_CLOUD"
                    },
                    "port": 20002,
                    "serviceName": "DEFAULT_GROUP@@sc-B",
                    "weight": 1.0
                },
                "metaInfo": {
                    "appName": "DEFAULT_GROUP@@sc-B",
                    "instanceId": "10.0.0.125#20002#DEFAULT#DEFAULT_GROUP@@sc-B"
                },
                "metadata": {
                    "$ref": "$[0].unknown[0].instance.metadata"
                },
                "port": 20002,
                "readyToServe": true,
                "zone": "UNKNOWN"
            },
            {
                "alive": true,
                "host": "10.0.0.52",
                "hostPort": "10.0.0.52:20002",
                "id": "10.0.0.52:20002",
                "instance": {
                    "clusterName": "DEFAULT",
                    "enabled": true,
                    "ephemeral": true,
                    "healthy": true,
                    "instanceHeartBeatInterval": 5000,
                    "instanceHeartBeatTimeOut": 15000,
                    "instanceId": "10.0.0.52#20002#DEFAULT#DEFAULT_GROUP@@sc-B",
                    "ip": "10.0.0.52",
                    "ipDeleteTimeout": 30000,
                    "metadata": {
                        "__micro.service.app.id__": "hkhon1po62@622bd5a9ab6ab48",
                        "preserved.register.source": "SPRING_CLOUD",
                        "__micro.service.env__": "[{"desc":"k8s-pod-label","priority":100,"tag":"gray","type":"tag"}]"
                    },
                    "port": 20002,
                    "serviceName": "DEFAULT_GROUP@@sc-B",
                    "weight": 1.0
                },
                "metaInfo": {
                    "appName": "DEFAULT_GROUP@@sc-B",
                    "instanceId": "10.0.0.52#20002#DEFAULT#DEFAULT_GROUP@@sc-B"
                },
                "metadata": {
                    "$ref": "$[0].unknown[1].instance.metadata"
                },
                "port": 20002,
                "readyToServe": true,
                "zone": "UNKNOWN"
            }
        ]
    }
]
In order to prove that what is obtained is the real scene, we scale the callee called by the application to 3 nodes through the container console. After completing the expansion, check the log and find that the list of available services has changed from 2 instances to 3 instances as expected.
One-click solution to the full-link gray-scale traffic escape problem
Sometimes a feature release depends on multiple services being upgraded and launched at the same time. We hope that the new versions of these services can be verified with small traffic at the same time. This is the unique full-link grayscale scene in the microservice architecture. By building an environment isolation from the gateway to the entire backend service, multiple different versions can be verified. service for grayscale verification. During the release process, we only need to deploy the grayscale version of the service. When the traffic flows on the call link, the grayscale traffic is identified by the gateways, middleware and microservices it flows through, and dynamically forwarded to the corresponding service. Grayscale version. As shown below:

The above figure can well show the effect of this scheme. We use different colors to represent the gray-scale traffic of different versions. It can be seen that both the microservice gateway and the microservice itself need to identify the traffic and make dynamic decisions according to the governance rules. . When the service version changes, the forwarding of this call link will also change in real time. Compared with the grayscale environment built by machines, this solution can not only save a lot of machine cost and O&M manpower, but also help developers to perform refined full-link control of online traffic in real time and quickly.
In the process of using full-link grayscale in our production environment, we often encounter some problems:
We configure whether the traffic flow of the full-link grayscale is in line with expectations, and whether our traffic is matched according to the grayscale rules we configured.
There are a lot of slow calls and exceptions in our grayscale traffic. How can I determine whether it is a business problem with our new version of the code or a system problem caused by our incomplete consideration in the traffic grayscale process? How to quickly locate the problem to achieve high efficiency iteration.
In the process of designing the grayscale system, we need to consider how to mark our grayscale traffic. Sometimes it may be difficult to find suitable traffic characteristics (parameters, headers, etc.) at the entrance application and microservice interface. Semantic identification), how can we quickly mark our traffic in such a scenario.
Based on the above series of problems, it is also a problem that we continue to encounter in the process of supporting customers on the cloud to implement full-link grayscale. Microservice insight capability is also a capability we abstractly designed in this process. For the appeal problem, our microservice insight ability can solve it very well.
Insight into gray-scale traffic, traffic escape problems are invisible
Regarding grayscale traffic, we tend to focus on the following three issues when using full-link grayscale:
- We configure whether the traffic flow of the full-link grayscale is in line with expectations, and whether there is traffic hitting non-grayscale applications
- Whether the traffic that conforms to the grayscale rule is marked with the corresponding grayscale label
- Whether the traffic that does not meet the grayscale rules has been mistakenly labeled with grayscale
Because if the grayscale traffic is not scheduled as expected, or the non-grayscale traffic is wrongly scheduled to the grayscale application, it will not only affect the test of the grayscale function, but even affect the normal operation of the non-grayscale application.
To answer the above three questions, we need the ability to observe the true labels and paths of gray-scale traffic in the system. To this end, we can add custom traffic rules, select the corresponding full-link grayscale label in the traffic filter condition section of the configuration rule, and select the request parameters, Headers and other information corresponding to the grayscale rules we configured in the print content. Logs of traffic with this grayscale label are automatically collected and printed.

By observing the parameters, headers and other information in the collected logs on the console, you can determine whether the traffic matching is correct, and whether the traffic that does not meet the grayscale rules has been incorrectly marked with grayscale labels. By observing the appName information in the grayscale traffic log, you can determine whether all the applications it passes through are grayscale versions, so as to determine whether the path of the full-link grayscale traffic meets expectations.
For the question of whether there is matching traffic that is not tagged, we can remove the traffic filter condition of the tag to collect all traffic, and by filtering parameters and other information in the console, we can observe whether any traffic that meets the conditions is not tagged. Grayscale labels.
The problem of locating grayscale traffic
In full-link grayscale, since grayscale applications and non-grayscale applications run in the overall system, it is more complex than daily scenes. When there are slow calls or exceptions in grayscale traffic, it will be more difficult to locate quickly, and the dynamic log printing capability of Microservice Insights can speed up this process.
Before the start of grayscale, if we do not have good expectations for possible problems, we can configure coarse-grained log rules at the entry application to facilitate us to observe the occurrence of problems.
When creating a rule, select the entry application. In the target interface list, we can add all web and rpc interfaces, or only add the ones we care about. Then select the corresponding grayscale label in the traffic filter conditions, enable the slow call and enter the slow call threshold (here, the slow call can be a call that is relatively slow relative to the original version rather than slow in an absolute sense) or enable an exception, and then In the print content, select the information required for positioning, such as request parameters, error information, call stack, etc.

Since this rule applies to the ingress application, we need to turn on the switch for subsequent link logs to print all logs on that traffic path.

After opening the rule, we can click on the dashboard corresponding to the rule to observe the collected logs.

Requests that meet the filter conditions and the logs of its subsequent links will be collected. We can choose to view the link details of a request in the request list, so as to find the specific location of the problem. For some problems, you can also see the exception stack, so as to determine the method call that caused the exception and the possible internal method that caused the exception, then we can configure custom traffic rules, select the custom buried point in the target interface, and Enter these suspect methods.

In the print content, you can select request parameters, return values and other information to assist judgment. After the rule is turned on, the logs of these methods can be printed to determine the cause of the problem.
Summarize
Based on common service invocation scenarios, this article takes the Ribbon load balancing component as an example to show that the microservice insight capability can restore and record rich on-site information for us at key locations, so that the original black-box scenario can be easily and intuitively observed. It turns out that under the microservice architecture, there are many similar important scenarios that are inconvenient to observe, and they can all be monitored with the help of the microservice insight capability or assist in the troubleshooting in case of anomalies. At the same time, full-link grayscale is a more important scenario in microservice governance. The two most troublesome problems we face in the process of implementing full-link grayscale are that traffic routing does not take effect and traffic escapes. The service insight capability can quickly locate and solve problems related to full-link grayscale.
We continue to polish and improve the MSE microservice insight capabilities, aiming to help us better manage our microservice applications and help enterprises build a complete microservice system on the cloud. Welcome everyone to try and experience~
#load #balancing #routing #microservice #application #site #place #click #Alibaba #Cloud #Cloud #Native #Personal #Space #News Fast Delivery