Meta announced that it has open sourced MemLab, a tool for finding memory leaks in JavaScript applications on Chromium-based browsers. Finding and addressing the root cause of memory leaks is important to provide a high-quality user experience on web applications, the announcement said. MemLab helped Meta’s engineers and developers improve the user experience and made significant improvements in memory optimization. “We hope it also contributes to the larger JavaScript community”.
Facebook.com Redesigned in 2020 as a Single Page Application (SPA), which uses client-side JavaScript for most of the rendering and navigation. And most of Meta’s other popular web apps are built using a similar architecture, including Instagram and Workplace. The company says that while this architecture enables it to provide faster user interaction, a better developer experience, and a more application-like feel, maintaining web application state on the client side makes managing client-side memory efficiently more complicated.
“People using our web applications usually notice performance and functional correctness issues immediately. However, a memory leak is another matter; it’s not immediately noticeable because it takes up a large chunk of memory at a time – impacting Entire web session and make subsequent interactions slower and less responsive. To help our developers solve this problem, we built MemLab, a JavaScript memory testing framework that automates leak detection and makes it easier to find memory The root cause of the leak. We used MemLab at Meta to successfully control unsustainable memory growth and identify memory leaks and memory optimization opportunities in our products and infrastructure. We have open sourced MemLab on GitHub and we are excited to Partner with the JavaScript community to get developers started using MemLab today.”
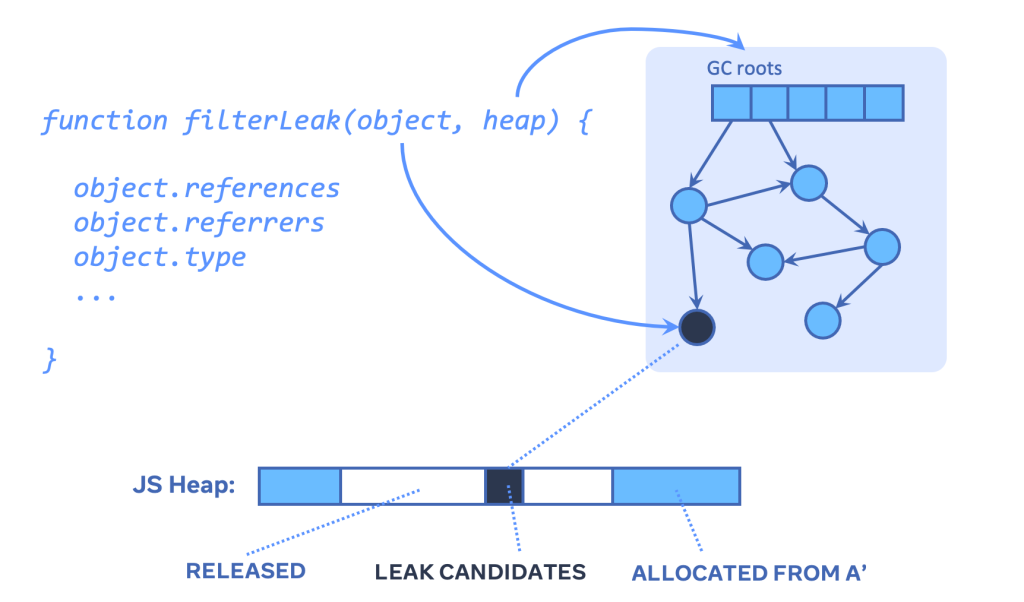
MemLab works by running headless browsers through predefined test scenarios and diffing JavaScript heap snapshots to find memory leaks. This process takes place in six steps:

- Differentiate heap
- Refine the list of memory leaks
- Generate retainer traces
- Clustering retainer traces
- report a leak

MemLab provides memory leak detection capabilities. For browser memory leak detection, the only input that MemLab requires from the developer is a test scenario file that defines how to interact with the web page via the overriding Puppeteer API and three callbacks for CSS selectors. MemLab automatically differentiates the JavaScript heap, corrects for memory leaks, and aggregates the results.

Another feature of MemLab is that it provides “JavaScript heap of Graph-view API”. A Node.js program or Jest test can also use the graph-view API to get a heap graph view of its own state,Do self-memory checks, and write various memory assertions.In addition to memory leak detection, MemLab also includes a set of built-in CLI commands and APIused to find memory optimization opportunities.
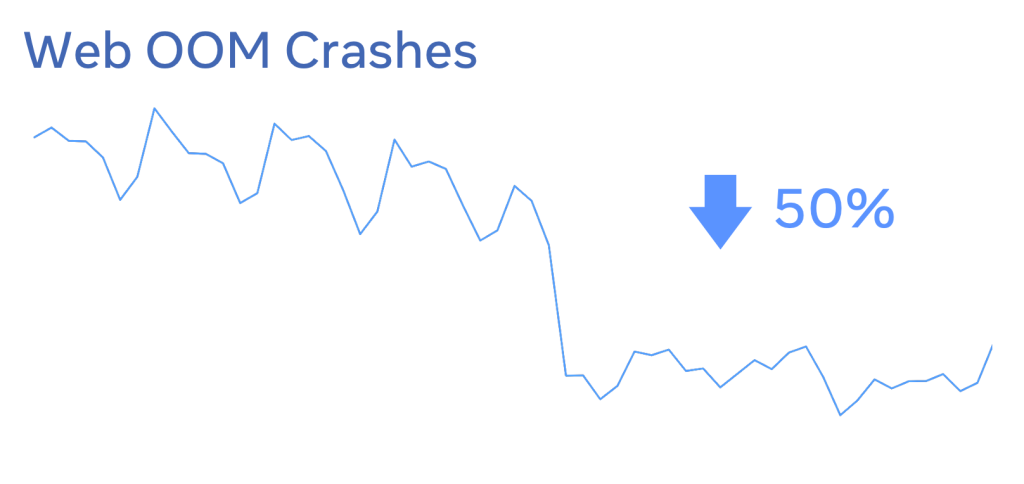
passUse MemLab to detect and diagnose memory leaks, Meta says itsReduced OOM crashes on Facebook.com by 50% in the first half of 2021.
More details can be found on the official blog.
#Meta #Open #Source #MemLab #JavaScript #Memory #Leak #Detection #Tool #News Fast Delivery