Compass is an open source project based on OPPO’s internal big data diagnostic platformwhich can be used to diagnose big data tasks running on scheduling platforms such as DolphinScheduler and Airflow.
Compass Core Functions
Compass currently supports the following functions and features:
-
Non-invasive, instant diagnosis, no need to modify the existing scheduling platform, you can experience the diagnosis effect.
-
Supports a variety of mainstream scheduling platforms, such as DolphinScheduler, Airflow or self-developed, etc.
-
Support multi-version Spark, Hadoop 2.x and 3.x task log diagnosis and analysis.
-
Support abnormal diagnosis of workflow layer to identify various failures and baseline time-consuming abnormal problems.
-
Support engine layer exception diagnosis, including 14 types of exceptions such as data skew, large table scan, memory waste, etc.
-
It supports the writing of various log matching rules and the adjustment of abnormal thresholds, and can be optimized according to actual scenarios.
Overview of diagnostic types supported by Compass:
|
Diagnostic Dimensions
|
Diagnosis type
|
type description
|
|
failure analysis
|
failed to run
|
Finally run the failed task
|
|
first failure
|
retries greater than1successful mission
| |
|
long term failure
|
recent10Days to run failed tasks
| |
|
time-consuming analysis
|
abnormal baseline time
|
Compared with the historical normal end time, tasks that end earlier or later
|
|
Baseline time-consuming anomalies
|
Tasks that are running too long or too short relative to their historical uptime
| |
|
Takes a long time to run
|
run time exceeds2hour task
| |
|
Error analysis
|
sqlfail
|
becausesqlTasks that failed due to execution problems
|
|
shufflefail
|
becauseshuffleTasks that failed due to execution problems
| |
|
out of memory
|
Tasks that fail due to out-of-memory issues
| |
|
cost analysis
|
memory waste
|
Tasks with a low ratio of peak memory usage to total memory
|
|
CPUwaste
|
driver/executorCalculation time and totalCPUTasks with a low proportion of computing time
| |
|
Efficiency Analysis
|
large table scan
|
Tasks that do not limit partitions causing too many rows to be scanned
|
|
OOMearly warning
|
Cumulative memory for broadcast tables vs.driverorexecutorAny task with a high memory usage
| |
|
data skew
|
stageexists intaskTasks that process the largest amount of data much larger than the median
| |
|
jobtime-consuming exception
|
jobfree time withjobTasks that take too much time to run
| |
|
stagetime-consuming exception
|
stagefree time withstageTasks that take too much time to run
| |
|
tasklong tail
|
stageexists intaskTasks whose maximum running time is much greater than the median
| |
|
HDFSStuck and stopped
|
stageexists intaskProcessing tasks that are too slow
| |
|
speculative executiontaskexcessive
|
stageappear frequently intaskspeculatively executed tasks
| |
|
global sort exception
|
Global sorting causes tasks that take too long to run
|
Compass Technical Architecture
Compass is mainly composed of task metadata module for synchronous workflow layer, synchronous Yarn/Spark App metadata module, associated workflow layer/engine layer App metadata module, workflow task anomaly detection module, engine layer anomaly detection module, and Portal display module .
Overall Architecture Diagram
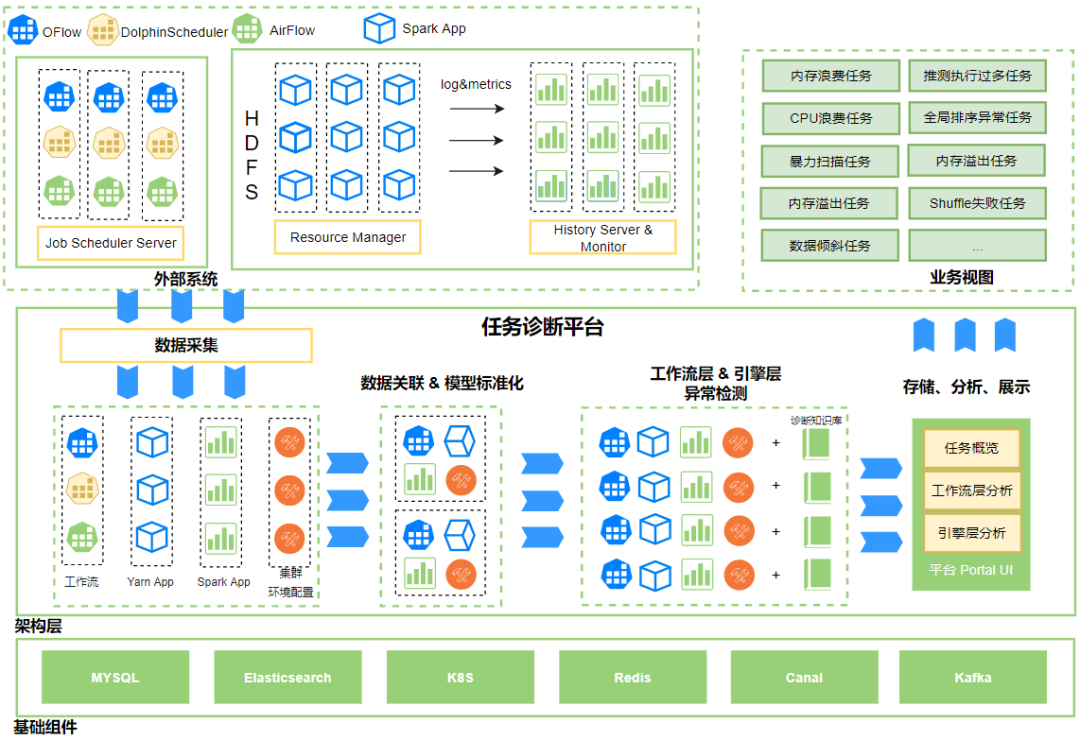
The overall architecture is divided into 3 layers:
-
The first layer is to interface with external systems, including scheduler, Yarn, HistoryServer, HDFS and other systems, to synchronize metadata, cluster status, operating environment status, logs, etc. until diagnostic system analysis;
-
The second layer is the architecture layer, including data collection, metadata association & model standardization, anomaly detection, and diagnostic Portal module;
-
The third layer is the basic component layer, including MySQL, Elasticsearch, Kafka, Redis and other components.
Specific module process stages:
(1)data collection stage: Synchronize workflow metadata such as users, DAGs, jobs, and execution records from the scheduling system to the diagnostic system; regularly synchronize metadata from Yarn ResourceManager and Spark HistoryServer App to the diagnostic system, mark the storage path of job running indicators, and make preparations for subsequent data processing stages Base;
(2)Data Association & Model Standardization Phase: Associate the workflow execution records collected step by step, Spark App, Yarn App, cluster operating environment configuration and other data through the ApplicationID medium. At this time, the metadata of the workflow layer and the engine layer have been associated, and the data standard model is obtained (user, dag, task, application, clusterConfig, time);
(3)Workflow layer & engine layer anomaly detection stage: So far, the data standard model has been obtained, and the Workflow anomaly detection process is further aimed at the standard model. At the same time, the platform maintains a set of data governance knowledge base that has been accumulated for many years, and the knowledge base is loaded into the standard model. Through heuristic rules, the index data of the standard model, Logs are simultaneously excavated for exceptions, combined with the status of the cluster and the state of the running environment, and analyzed to obtain abnormal results at the workflow layer and engine layer;
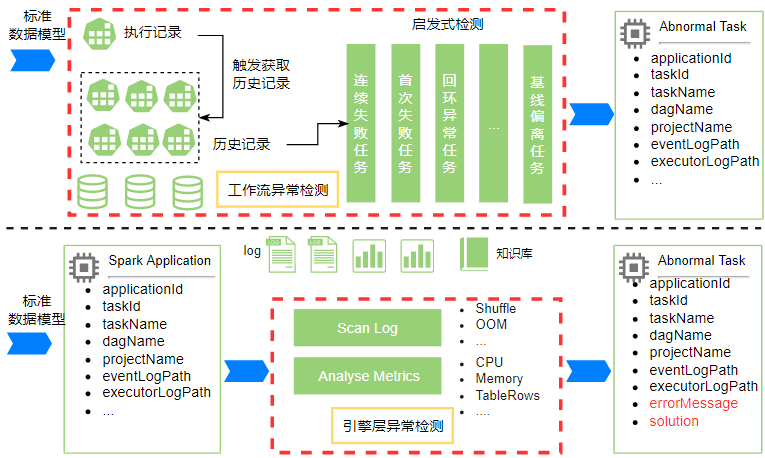
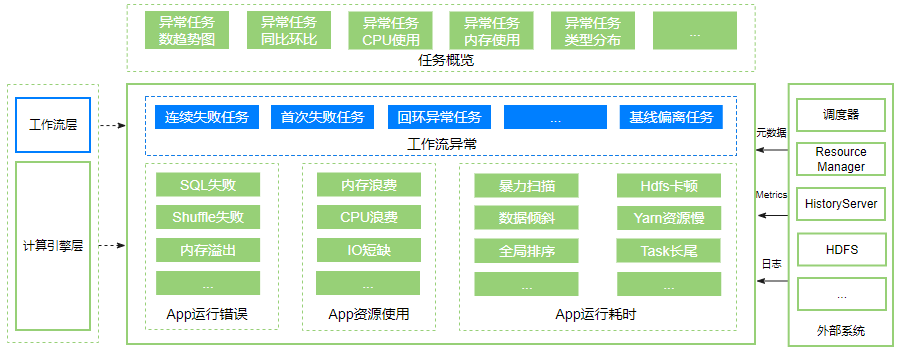
(4)business view: Store and analyze data, provide user task overview, workflow layer task diagnosis, engine layer job Application diagnosis, workflow layer displays exceptions caused by scheduler execution tasks, such as task failure, loopback task, baseline deviation task, etc., calculation The engine layer shows the time consumption, resource usage, and runtime issues caused by Spark job execution.
#Compass #Homepage #Documentation #Downloads #Big #Data #Task #Diagnosis #Platform #News Fast Delivery