foreword
for pprof, I believe that programmers who are familiar with the Go language are basically familiar with it. Generally, online problems can be quickly located by it. But in actual projects, we often don’t enable it for performance reasons, but we have to rely on it to analyze problems. Fortunately, go-zero has been well integrated for us. We only need to turn it on and off like a switch, so that we can cooperate with operation and maintenance monitoring. When there are abnormalities such as cpu and memory, it will automatically start Start the collection (such as when you are sleeping soundly in the middle of the night), then the next day you can restore the scene by analyzing the sampling at that time, then let’s see how go-zero does it.
Source code analysis
We can look at the go-zero source code location https://github.com/zeromicro/go-zero/blob/master/core/proc/signals.go
func init() {
  go func() {
    ...
    signals := make(chan os.Signal, 1)
    signal.Notify(signals, syscall.SIGUSR1, syscall.SIGUSR2, syscall.SIGTERM)

    for {
      v := <-signals
      switch v {
      ...
      case syscall.SIGUSR2:
        if profiler == nil {
          profiler = StartProfile()
        } else {
          profiler.Stop()
          profiler = nil
        }
      ...
    }
  }()
}
When the service starts, go-zero is in init The listen signal operation is initialized (gracefulStop It is also notified here, so I won’t talk about it here), you can see that after receiving syscall.SIGUSR2 When it comes to signals, if it is the first time to start collecting, and the second time to stop collecting, you may understand it instantly when you see this, we only need to execute it on the server kill -usr2 <服务进程id> you can start collecting the service pprof information, execute it again to stop the collection, you can export these files to the local, use go tool pprof analyze.
an online battle
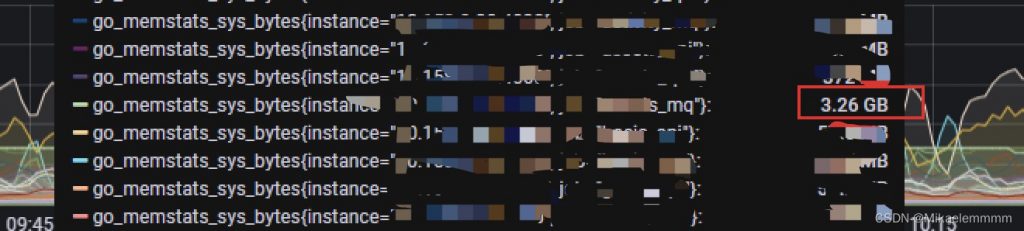
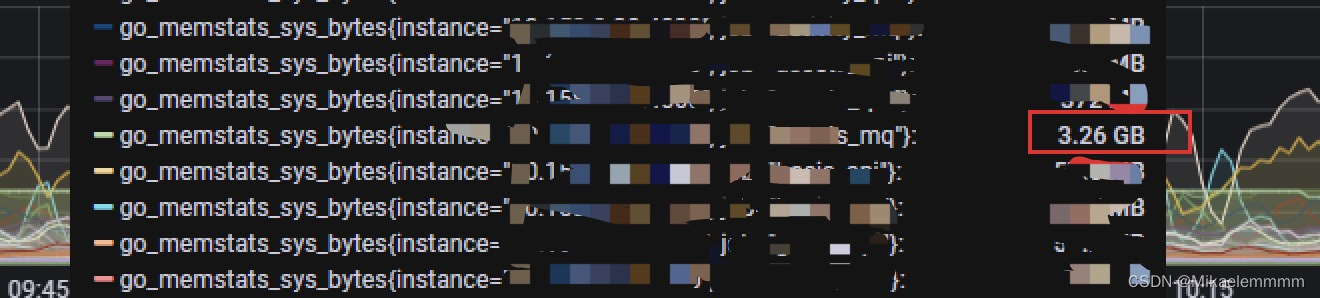
we have one online mq The service monitoring alarm, the memory usage is relatively high, at this time I open grafana It can be seen that the accumulated service memory usage is indeed abnormal, as shown in the figure below:
At this time, find the server of this service online and execute ps aux | grep xxx_mqfound this mq service process ID is 21181, we can give this xxx_mq Service send signal collection pprof information:kill -usr2 21181
After executing this command for the first time, in the corresponding service access.log can be seen in the log enable up pprofwhen we execute again kill -usr2 21181,access.log can be seen in the log disable up pprof Information, at this point the collection is complete.It is worth noting that the information collected is in the /tmp Under the folder, named after this service name is as follows:
- xxxx-mq-cpu-xxx.pprof
- xxxx-mq-memory-xxx.pprof
- xxxx-mq-mutex-xxx.pprof
- xxxx-mq-block-xxx.pprof
- .......
At this time, you can download the corresponding pprof To analyze locally, you can use go tool pprof xxxx-mq-memory-xxx.pprofcan also be matched with graphviz use web ui Check, because I quickly located the problem through the command line, it is useless web ui.
I use go tool pprof xxxx-**-mq-memory-xxx.pprof Then enter the command line interaction, use top 30 Check out the high resource usage.
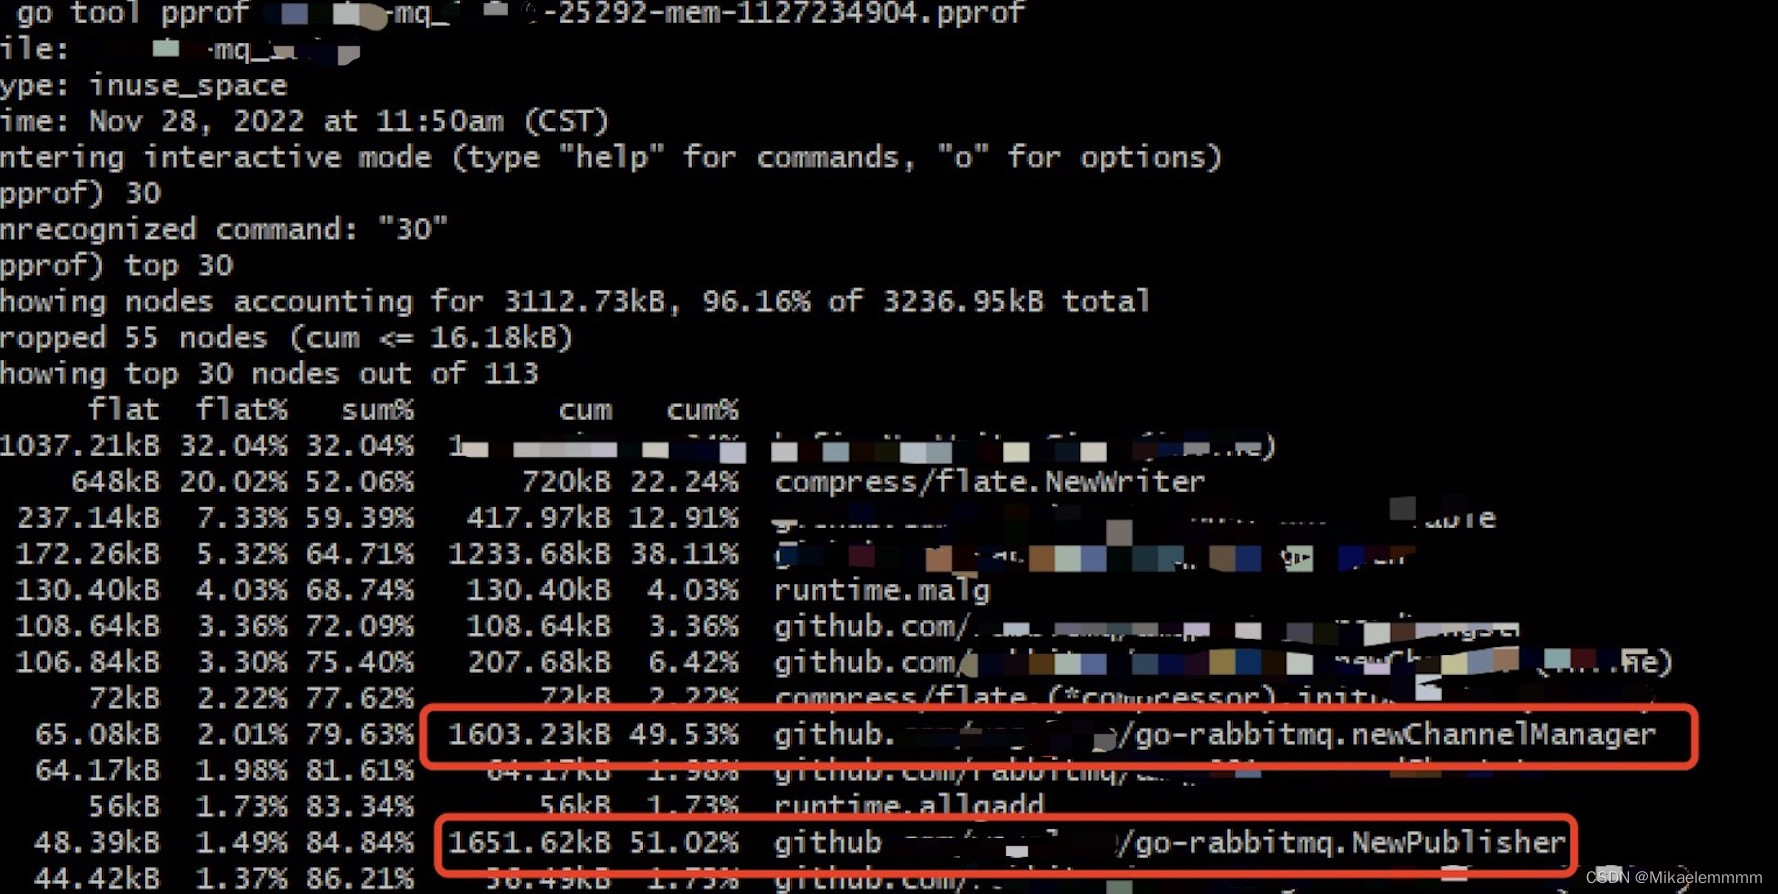
The front is basically the underlying serialization and other operations. It is found that the main problem is concentrated in the red box, which leads to the continuous increase in memory, because the business students are in the mq After the message is consumed in the middle, it is used by other mq services downstream publisher send a mq message, each send calls a NewPublisher then in defer closeexactly this mq The service consumes a large amount of messages and is particularly frequent, which leads to continuous increase in memory. The final solution will be NewPublisher exist svcCtx initialize a client That’s it, you don’t have to do it every time NewPublisherthe world has returned to cleanliness.
write at the end
Consider that go-zero gives us pprof The switch allows us to easily implement and analyze problems, but not all problems exist all the time, such as sudden memory and high CPU in the middle of the night, and the service is normal when we wake up in the morning. How to troubleshoot this? So we hope that if there is an abnormality, we can save the problem site. Can we cooperate with operation and maintenance monitoring to automatically save the problem site?For example, the memory and cpu continuously exceed 80% If the index is 3 minutes, we will call this switch to collect, and then we can analyze the problem according to this file, so that it can be automated.
project address
go-zero microservice framework: https://github.com/zeromicro/go-zero
https://gitee.com/kevwan/go-zero
go-zero microservice best practice project: https://github.com/Mikaelemmmm/go-zero-looklook
welcome go-zero and star Support us!
WeChat exchange group
focus on”Microservice Practice』Official account and click Exchange group Obtain the QR code of the community group.
#service #automatically #collects #online #problem #site #kevwans #personal #space #News Fast Delivery