data visualization engine The official release of G2 5.0 “Spring” is now released. This major version update includes a more concise and professional visualization syntax, richer chart types and chart features, and a new API and architecture that is easy to expand. While improving the flexibility and ease of use of G2, it also laid a solid foundation for the long-term stable iteration and ecological construction of G2 in the future.
“We hope that G2 is not only a tool for visualization, but also that it can convey correct visual thinking to users: let people acquire the ability to think visually in the data world. We will continue to polish it, and hope that more like-minded partners in the community will participate in co-construction through various forms.“
Progressive Visual Grammar
According to the announcement, G2 had a simple vision from the beginning: “One sentence draws a graph.” To this end, the development team practiced the core theory of “The Grammar of Graphics”: rejecting the taxonomy of graphs, and using a series of visual components to describe a graph. Compared with “one picture, one drawing”, the types of charts that can be drawn are greatly enriched. However, as the visualization scenarios become more and more complex, and based on the feedback from internal and external users, we found that there is still a lot of room for improvement in the ease of use and flexibility of G2.
For this, its reference front-end framework React and Vue The programming paradigm of reuse logic gives the design principle of “Mark is a first-class citizen”, and proposes a set of “progressive visual grammar”: a visual grammar that can be learned and adopted step by step, while ensuring that the complexity is almost unchanged It can provide continuous support for increasingly rich and demanding visualization scenarios.
At the same time, at the level of visual description, we refer to the Vega-Lite The design of visual grammar improves the versatility and professionalism of G2 grammar, hoping to deliver correct and professional visual thinking to users, improve development efficiency and benefit more from visualization.
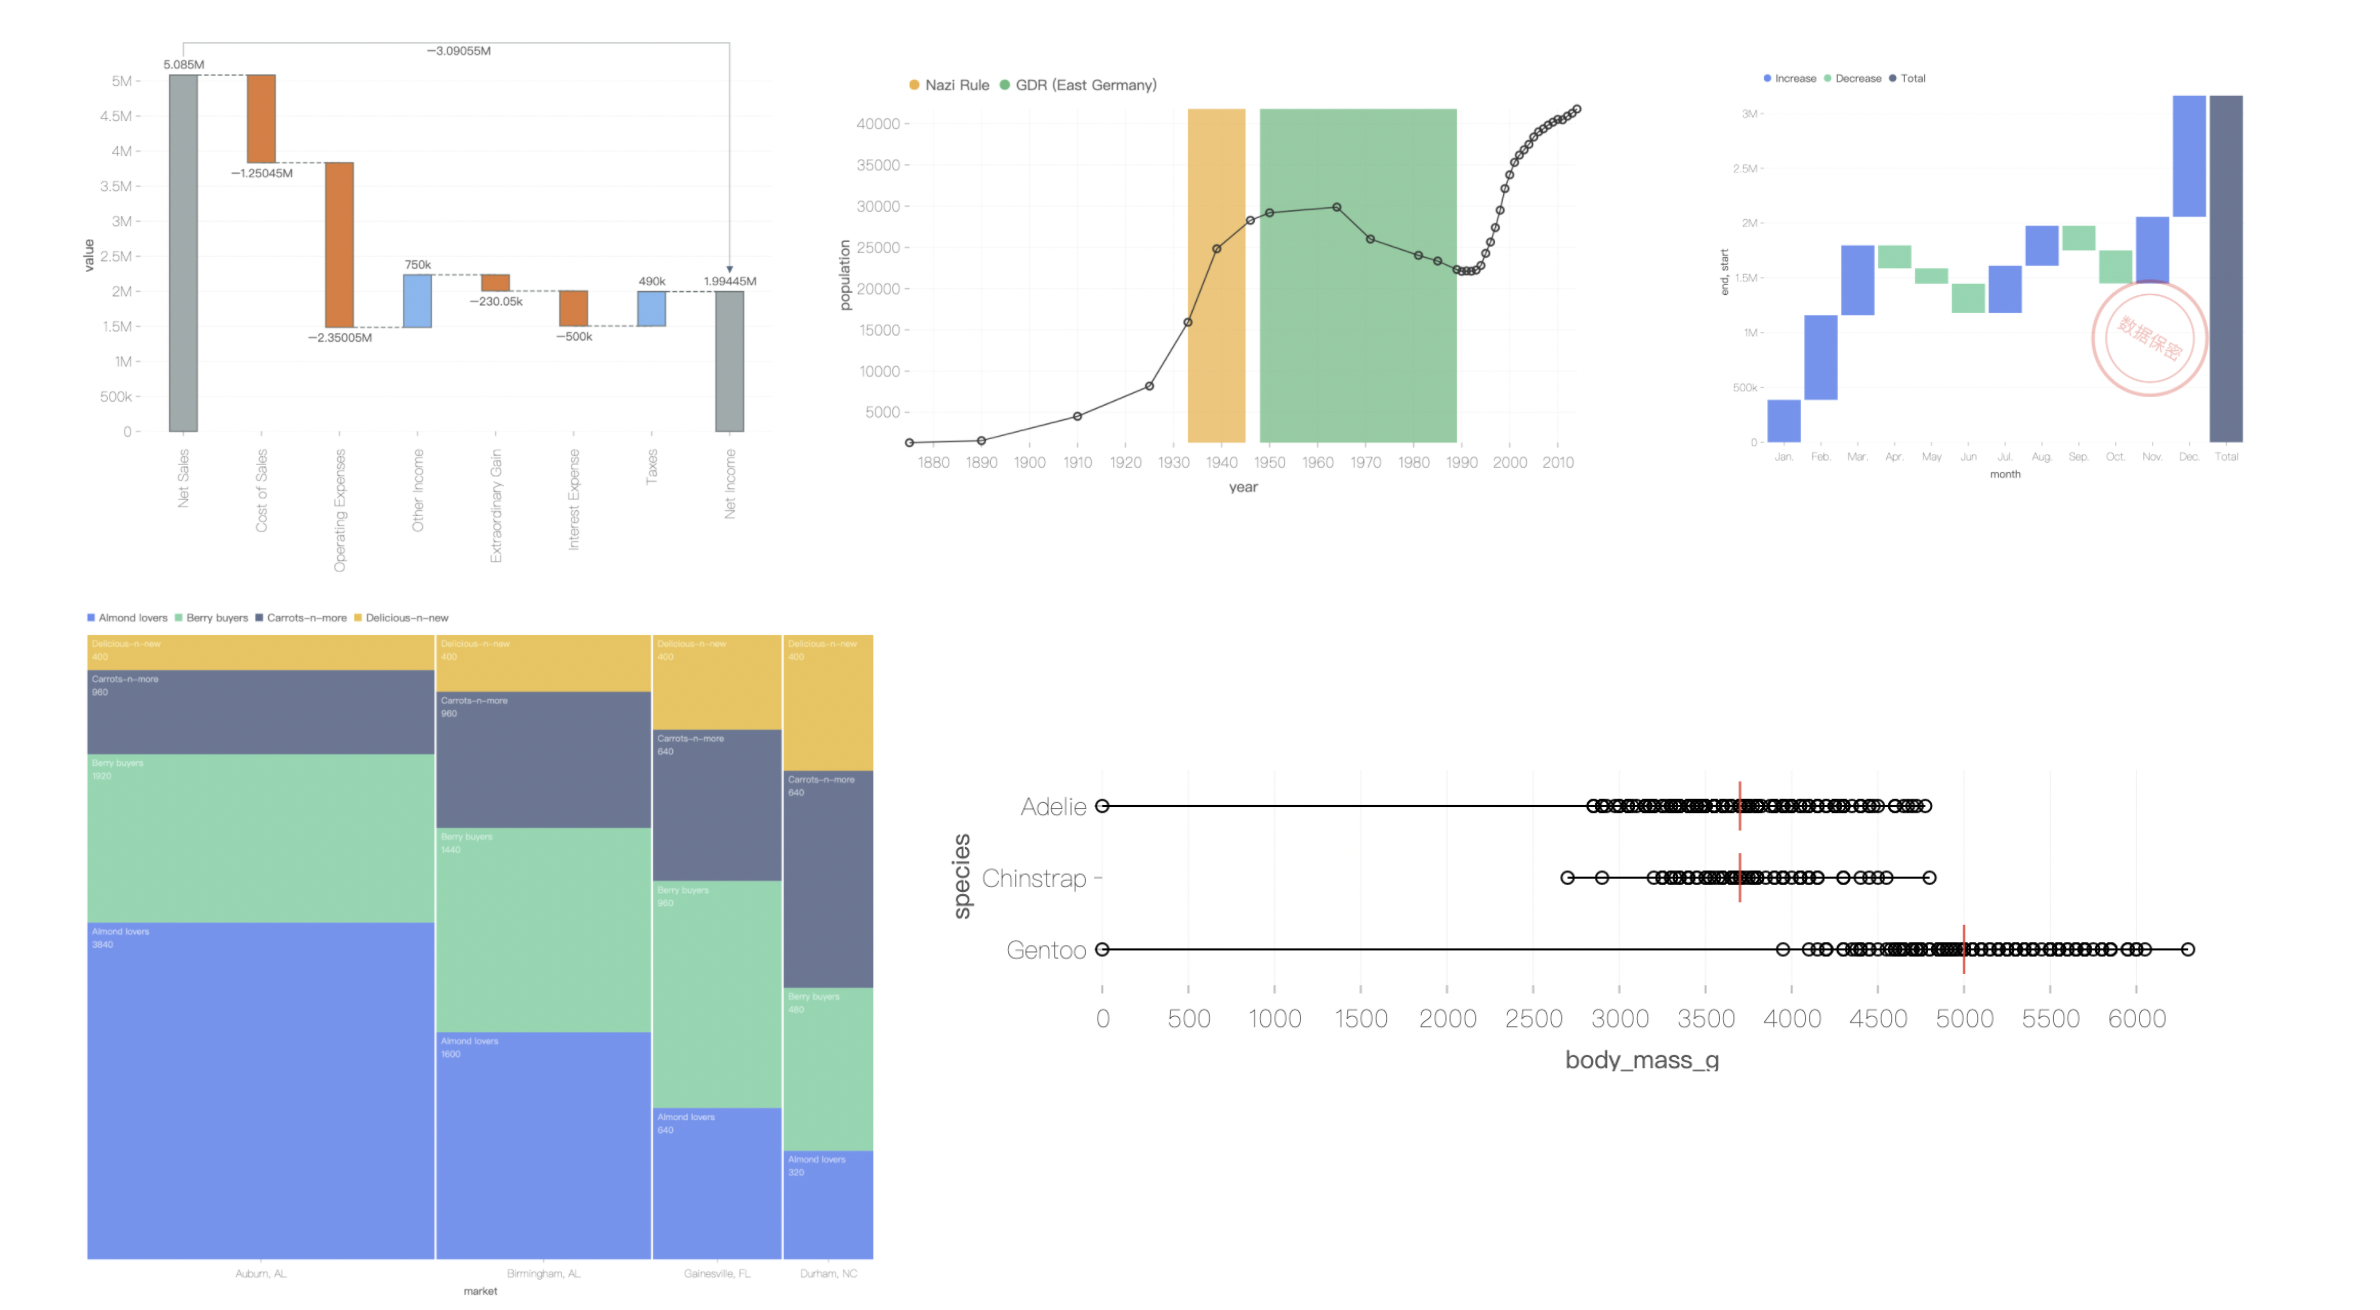
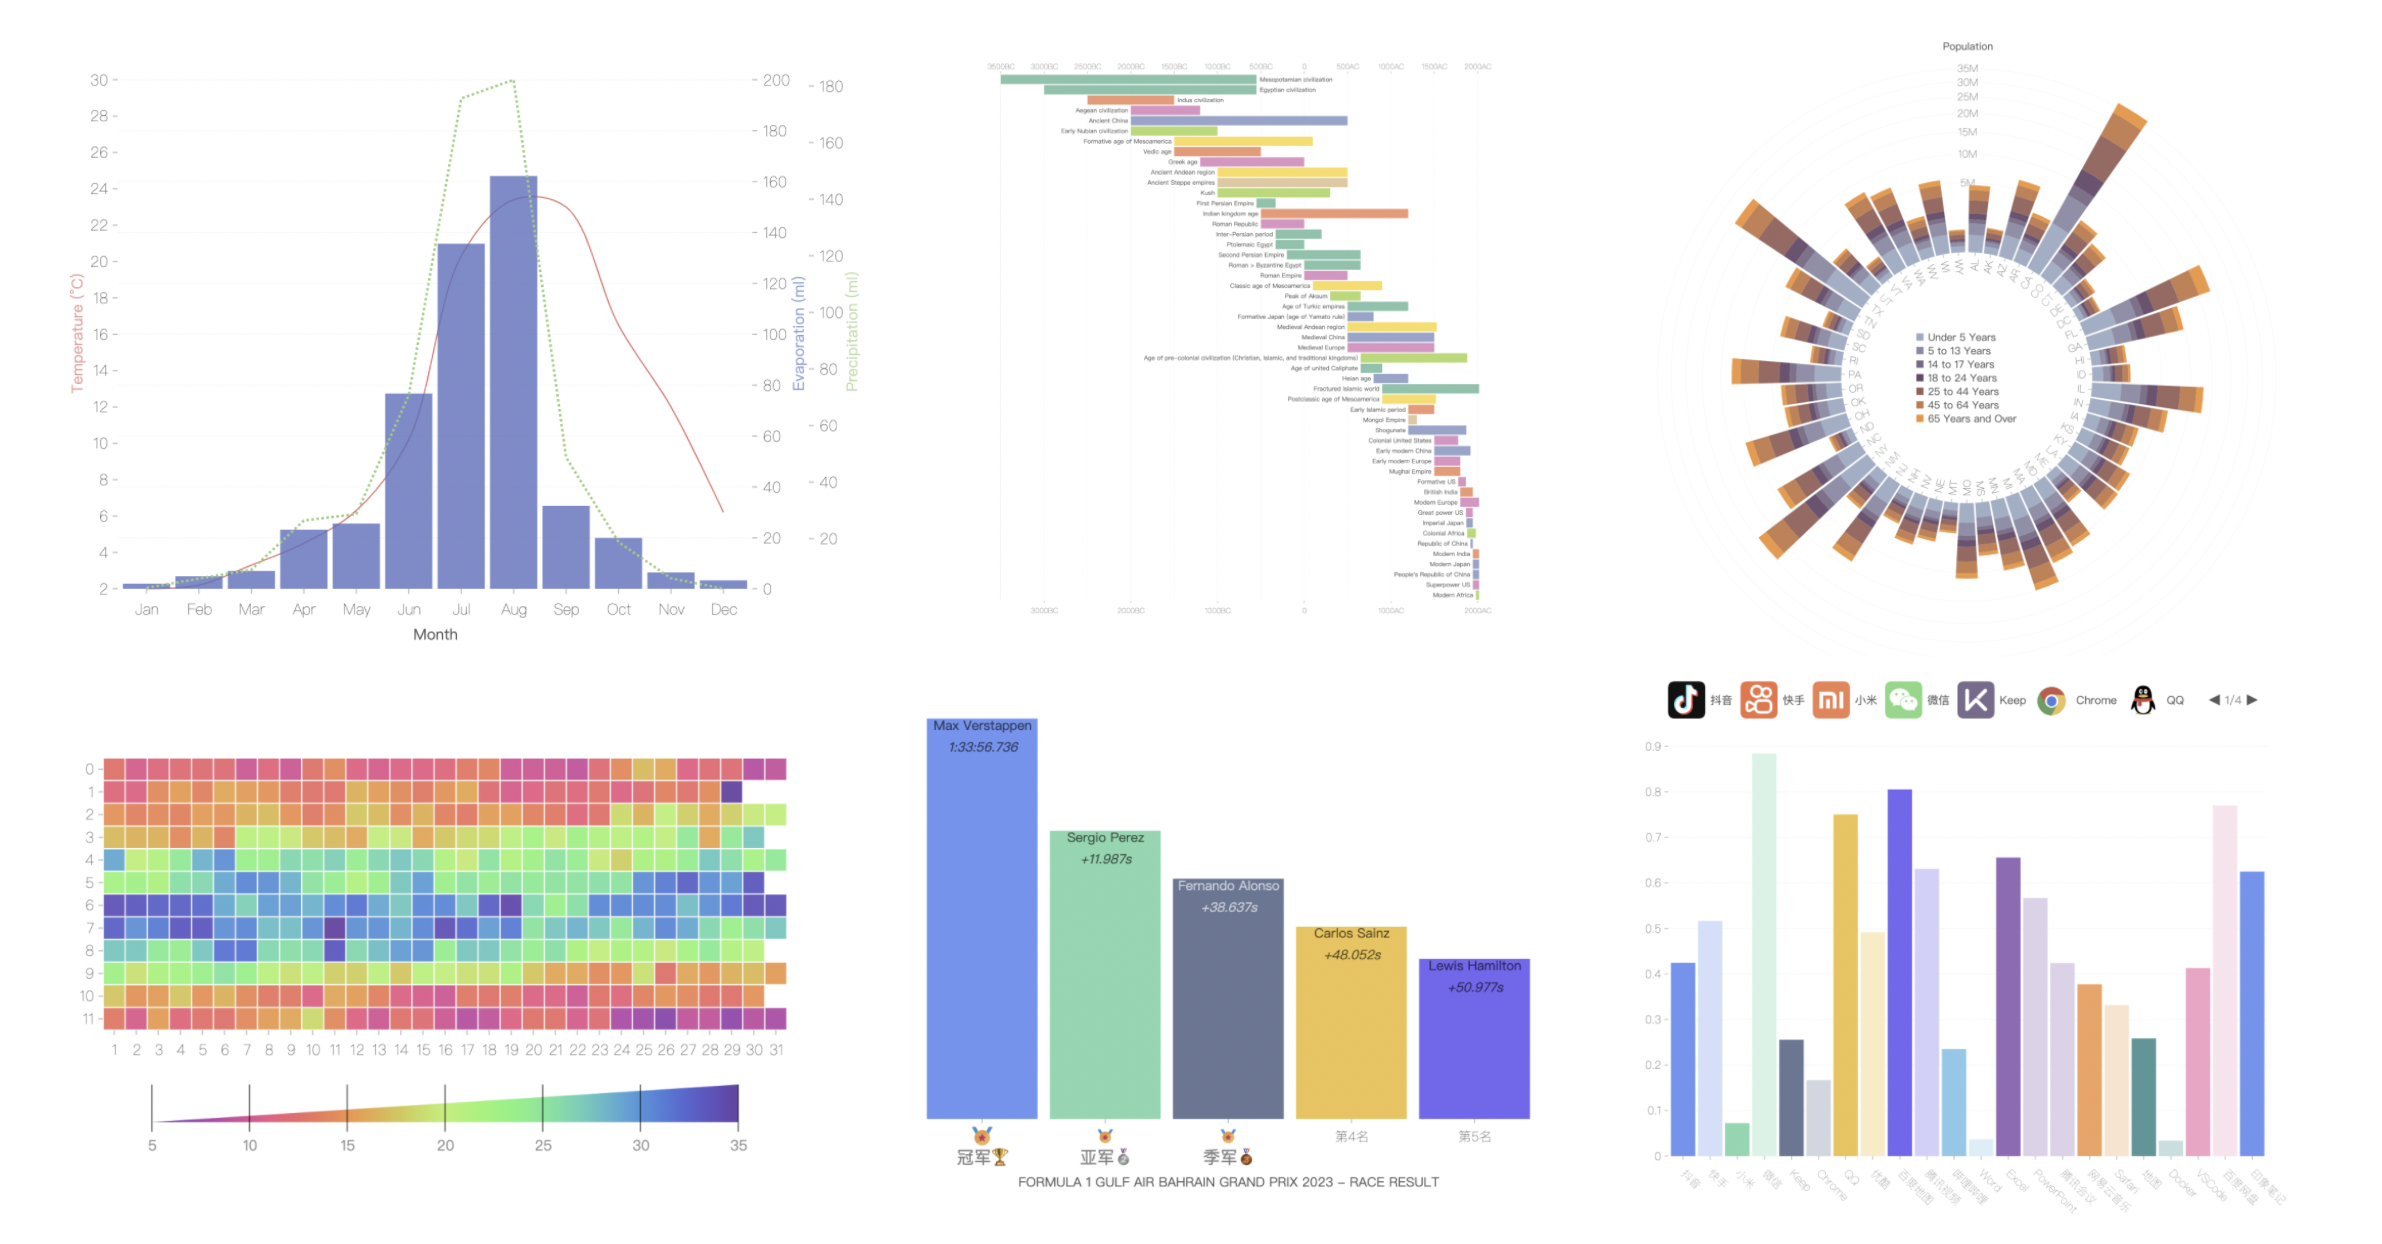
Richer chart types
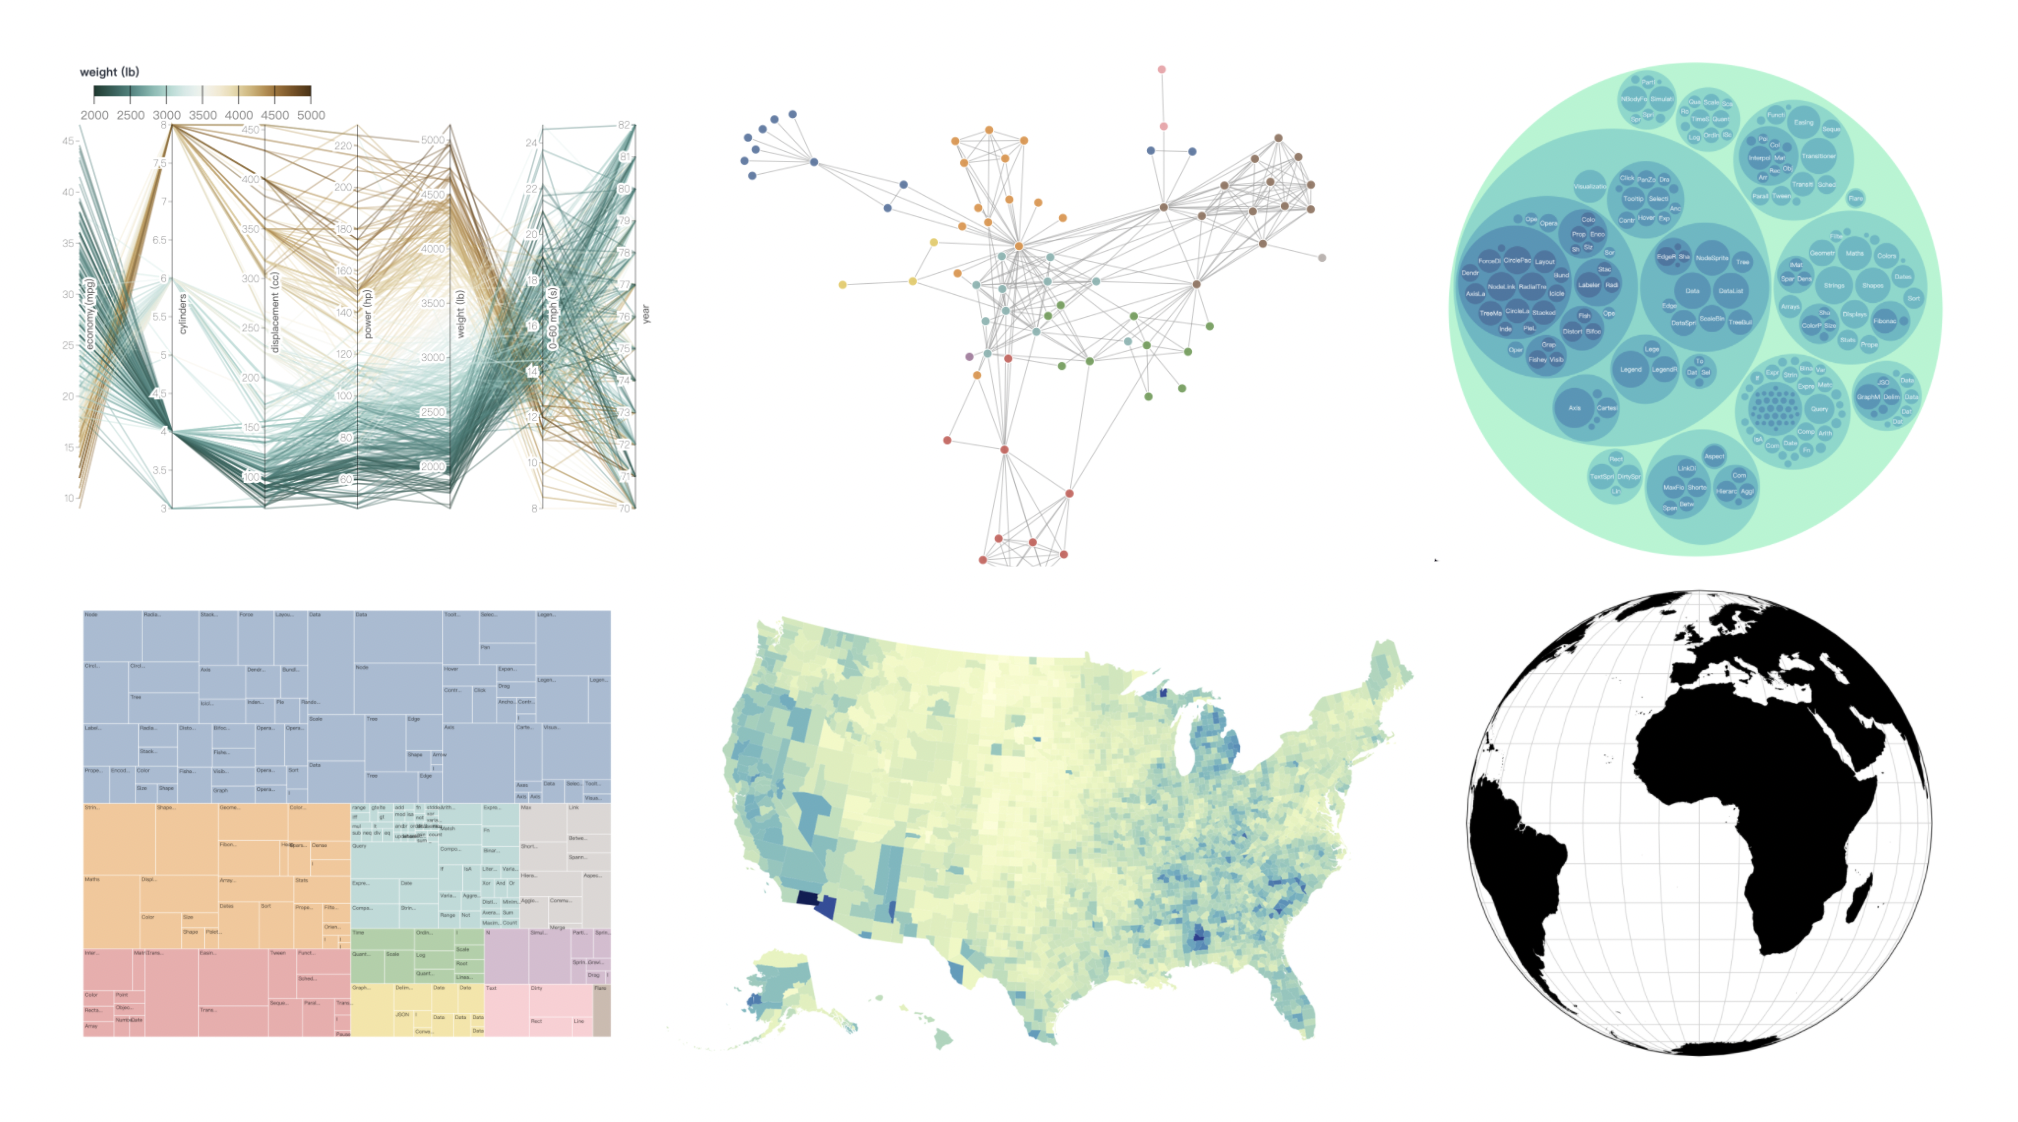
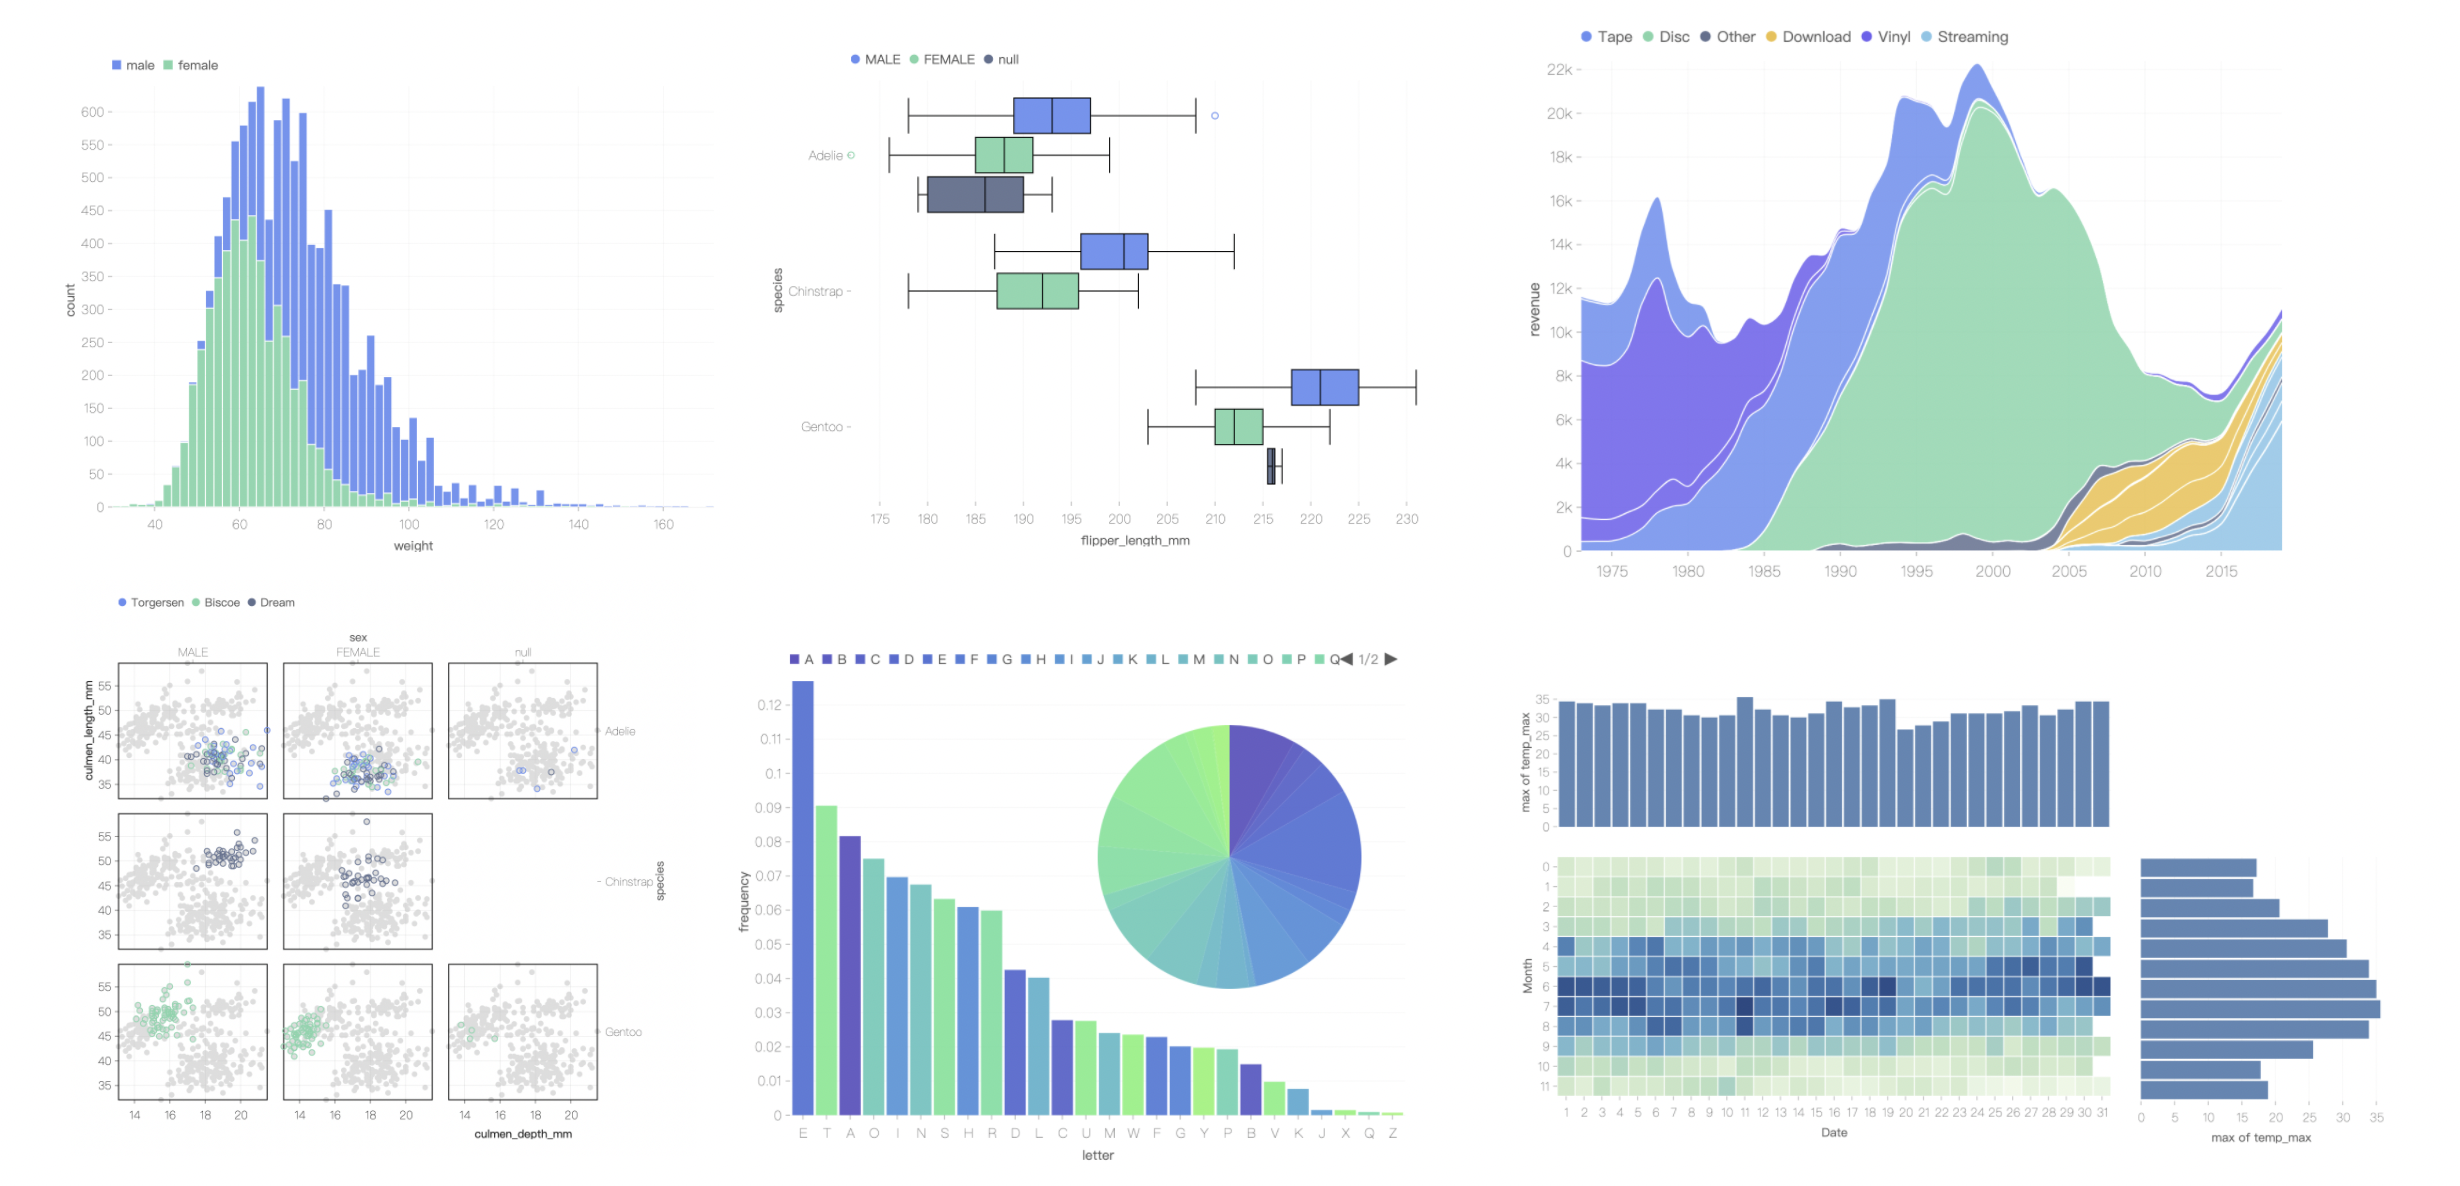
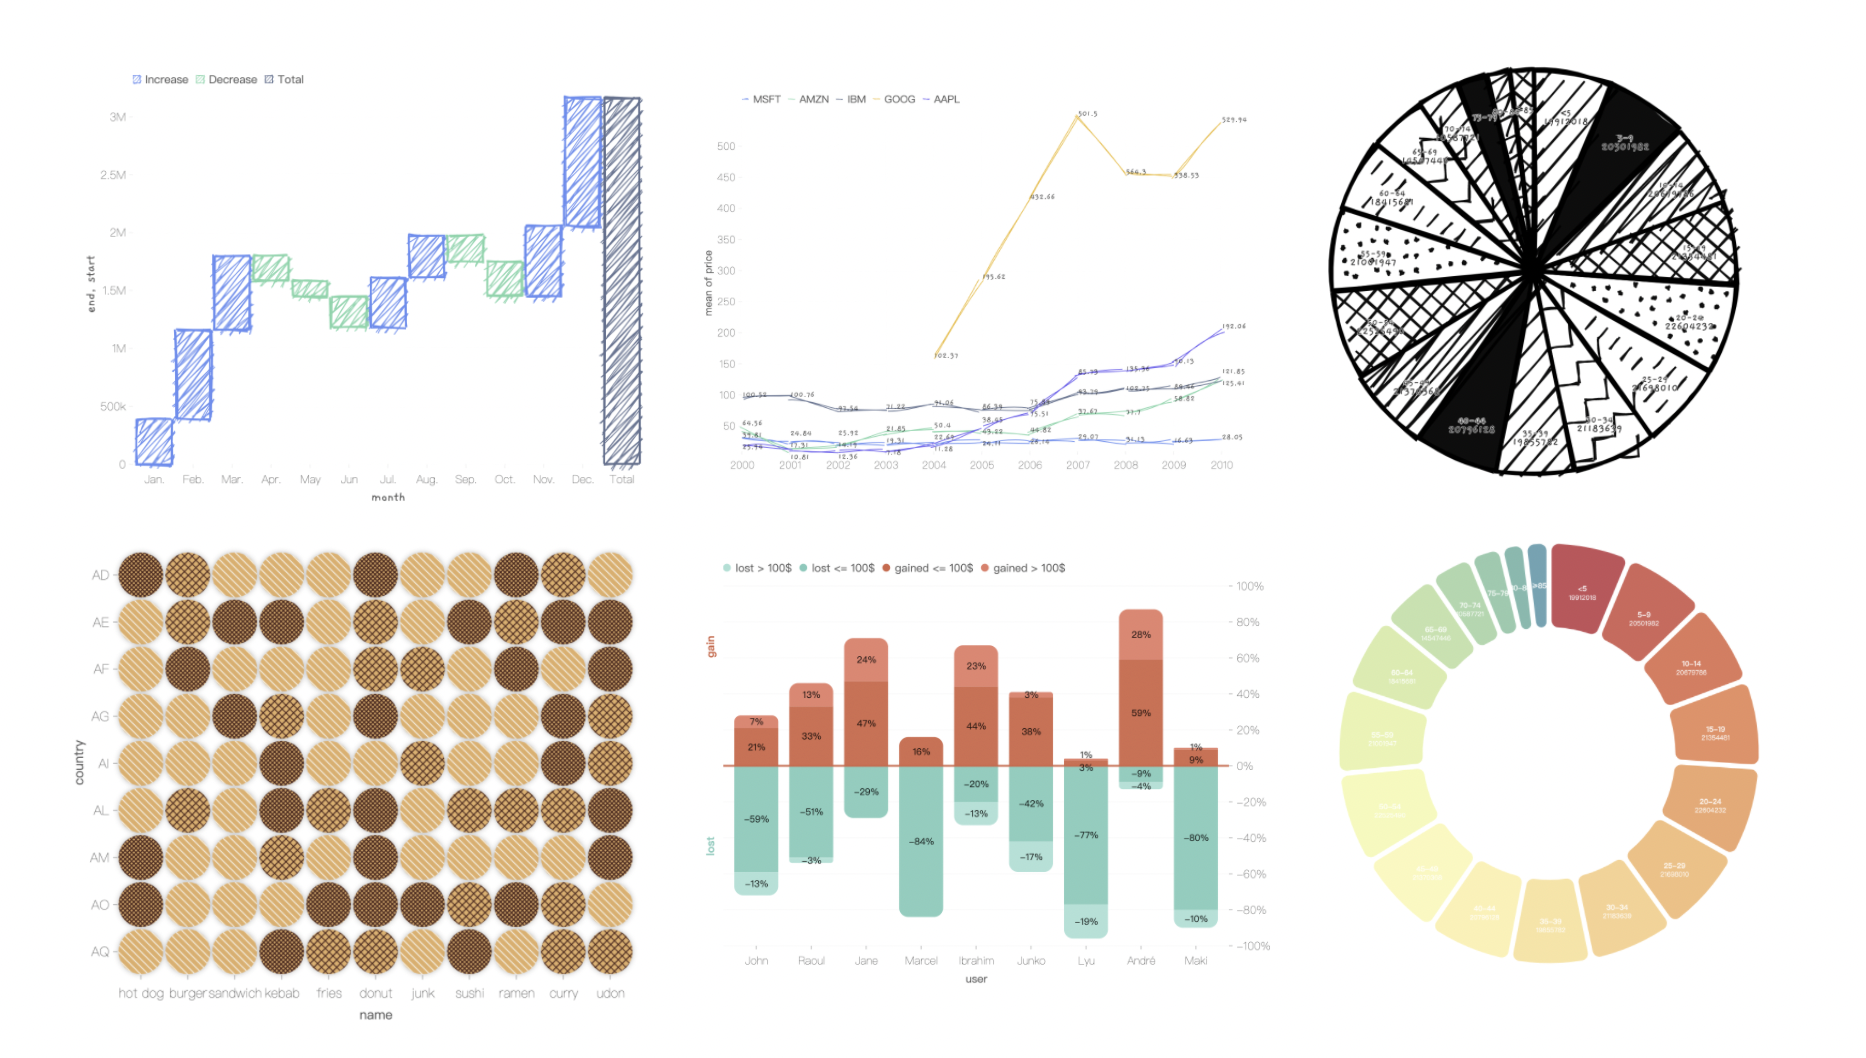
In order to meet the demands of different scenarios, 5.0 has added more chart types: parallel coordinate system, mosaic chart and differential area chart, etc., and will also directly support the drawing of dashboards, water wave charts and Venn diagrams.In addition, because of the “all-encompassing” graphics grammar itself and the increase in composite data type scenarios, G2 will not only provide simple support for statistical data, but also for relational data and geographic data visualization (more professional and complex move forward G6 and L7).
New Data Analysis Capabilities
Large-scale and complex data analysis is often done by the backend. For small-scale and specific scenarios, the development team refers to D3 author Mike Bostock latest open source Observable Plot, designed transform API to standardize the ability of data analysis. It enables users to complete analysis tasks such as grouping, binning, and finding outliers through a concise API.On the other hand, also refer to Vega-Lite’s view composite design, Microsoft Team’s Atoms Unit visualization syntax, as well as the DOM tree specification for front-end development, designed a view tree to describe visualization. This not only makes it easier to analyze high-dimensional data, but also upgrades from “drawing a chart in one sentence” to “drawing a report in one sentence”, and puts different data sets on the same page for analysis.
Brand New Animation Capabilities
Animations in visualization can improve user pleasure and better display and analyze time series data. 4.0 and most mainstream visualization frameworks do not provide declarative animation syntax. In order to make up for this defect, the development team refers to Shandong University canis The animation syntax adds to 5.0 the ability to encode animation properties and perform grouped animations.Also refer to CSS Animation specification, designed temporal containers that simplify the cost of declaring visual narratives.
Improved data labeling capabilities
Data annotation is often used to provide users with interesting auxiliary information. In the 4.0 design, Annotation and Geometry are two different implementations, which makes the ability of annotation not as flexible and powerful as geometric elements. In 5.0, both annotations and geometric elements are marked Mark, and have the same rendering process, so that annotations also have the ability to declaratively batch draw, support data conversion, support animation, and display prompt information. At the same time, for each graphic element, multiple data labels Label can also be added.
Component display capability improvement
Components such as coordinate axes and legends can help users speed up their understanding of visualizations, and the display of components has been optimized in 5.0. Including adaptive layout supporting multiple coordinate axes, more legend layout modes, and customization of various parts using HTML. The confusing display of Ticks text has always been a pain point of the component. The new version has built-in d3-format to make the formatting work easier.
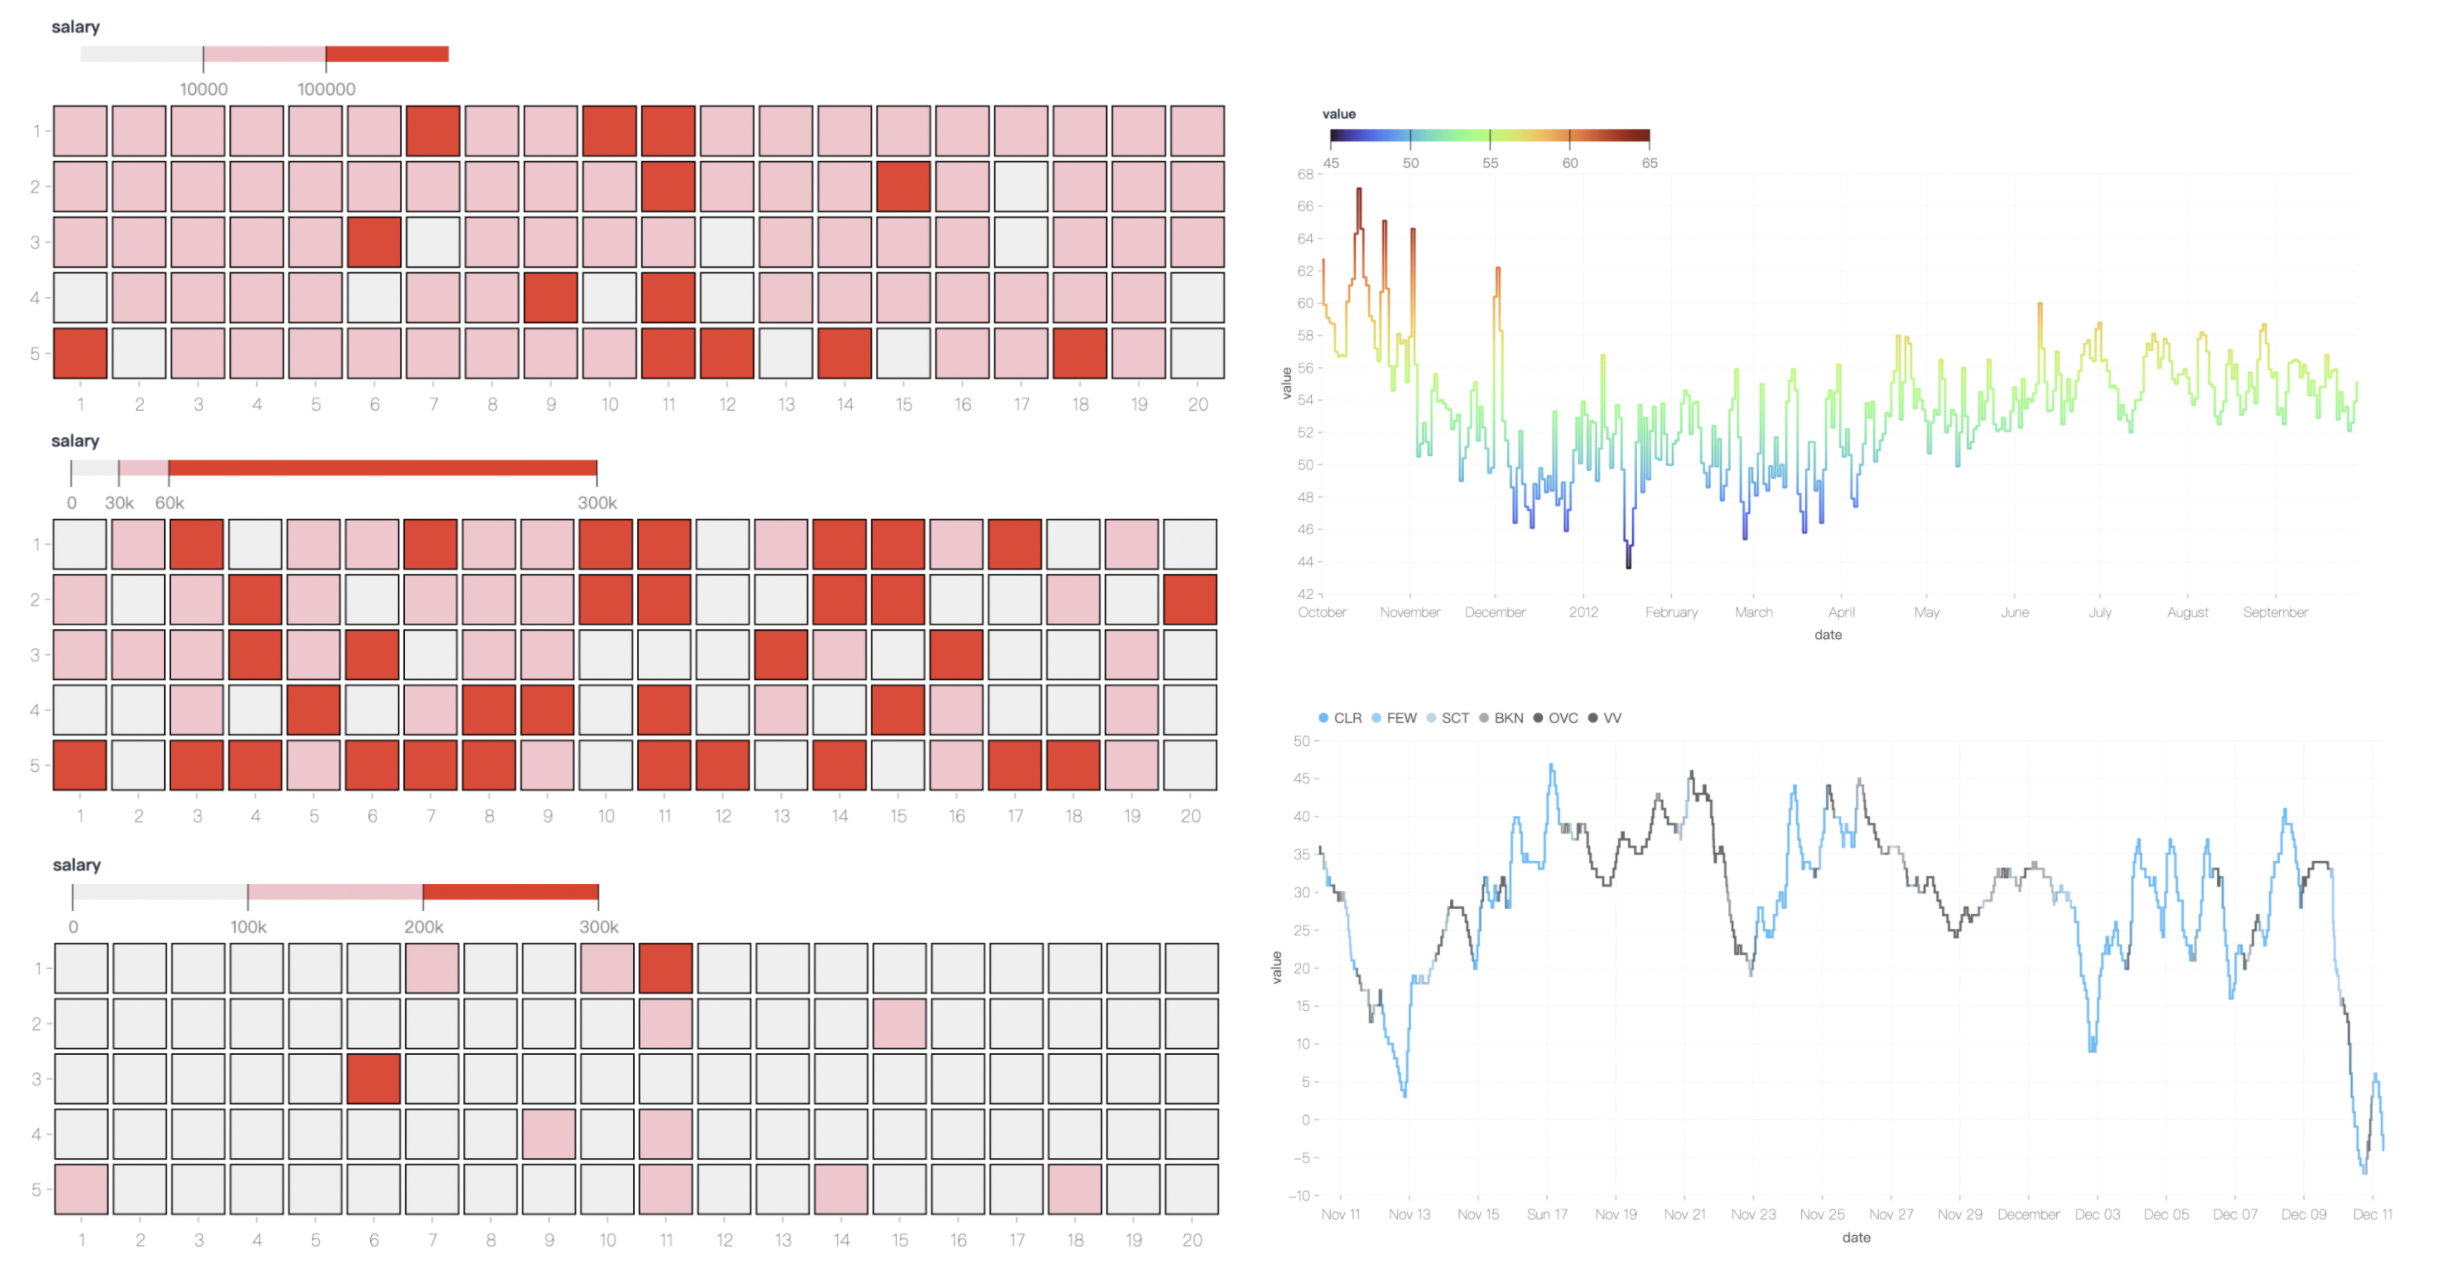
Improved color expression
The color channel is an important channel in visualization, which can efficiently display encoded information. 5.0 enhances the ability to display continuous color channels, including providing Threshold, Quantile and Quantize scales to discretize colors, making the distribution of color differences more obvious and uniform.also built in d3-scale-chromatic The discrete swatches and continuous interpolators in , provide more choices of color spaces. Continuous gradient color coding is also supported for line charts.
Rich personalized style
In order to personalize the scene and interesting needs, with the help of the underlying powerful rendering engine @antv/g, All charts support hand-drawn styles and textures. At the same time, the rounded corner display of bar charts and pie charts is also optimized.
Experimental Features Spec API
G2 provides a function-style chain API Chart to declare charts, which makes chart declarations more free. However, the development team found that this unstructured API is not friendly to some users, and it is not conducive to the encapsulation of upper-level tools. Therefore, while enhancing the traditional Chart API, G2 5.0 introduces a new set of Spec API, which aims to reduce the use and learning costs of G2 and facilitate ecological expansion. The Spec API is the basis of the Chart API, providing features like ECharts and G2Plot That ability to declare charts via JavaScript objects.
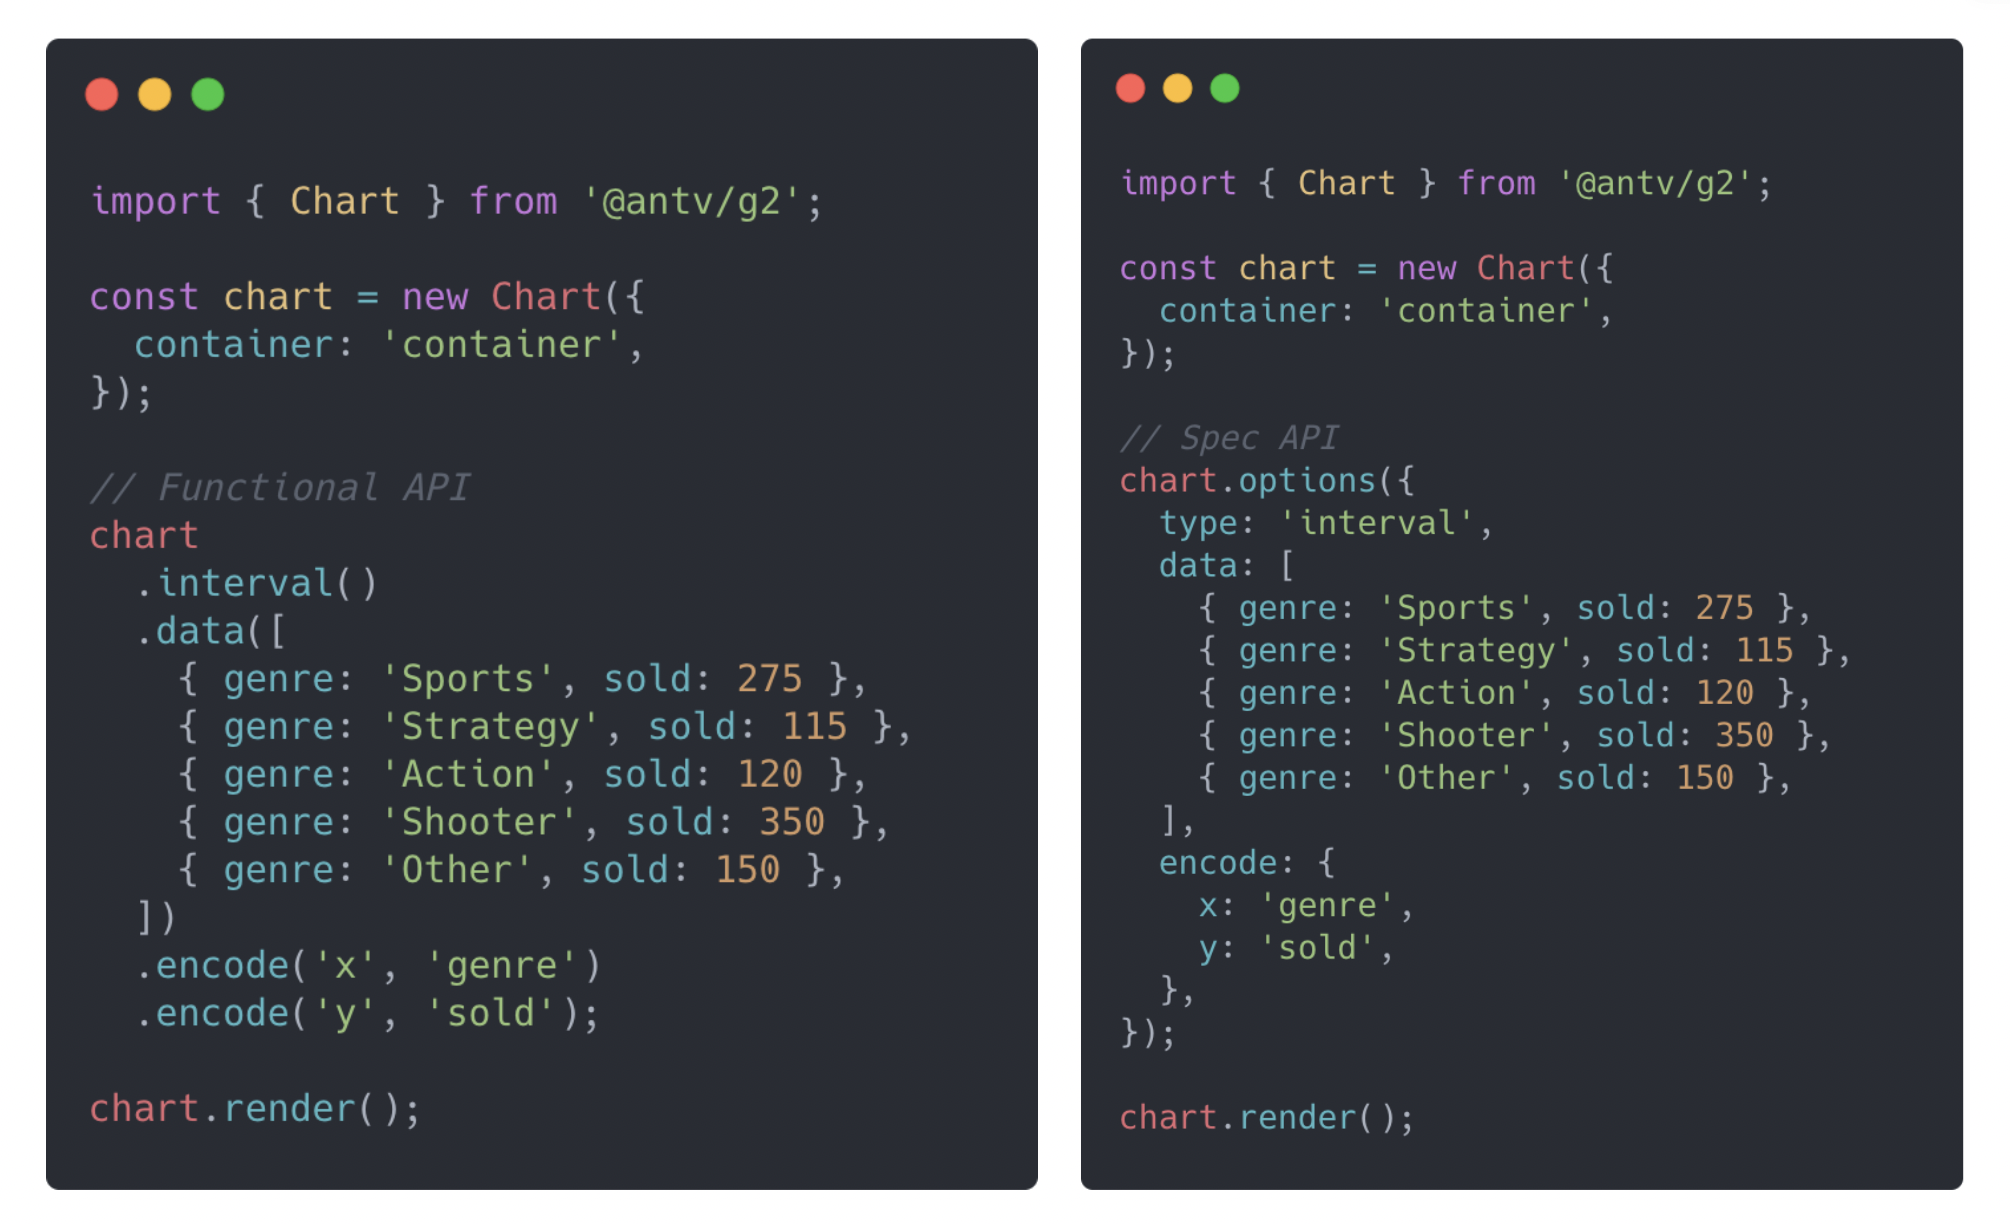
At present, the Spec API has been implemented in G2, and can be called by calling chart.options(options) use. But the purpose of exposing this feature is only to gather feedback and give a preview to libraries that depend on the relevant capabilities.Officially stated that it will @antv/ava The team tests and iterates on this feature together, and it may be officially released in version 5.1.
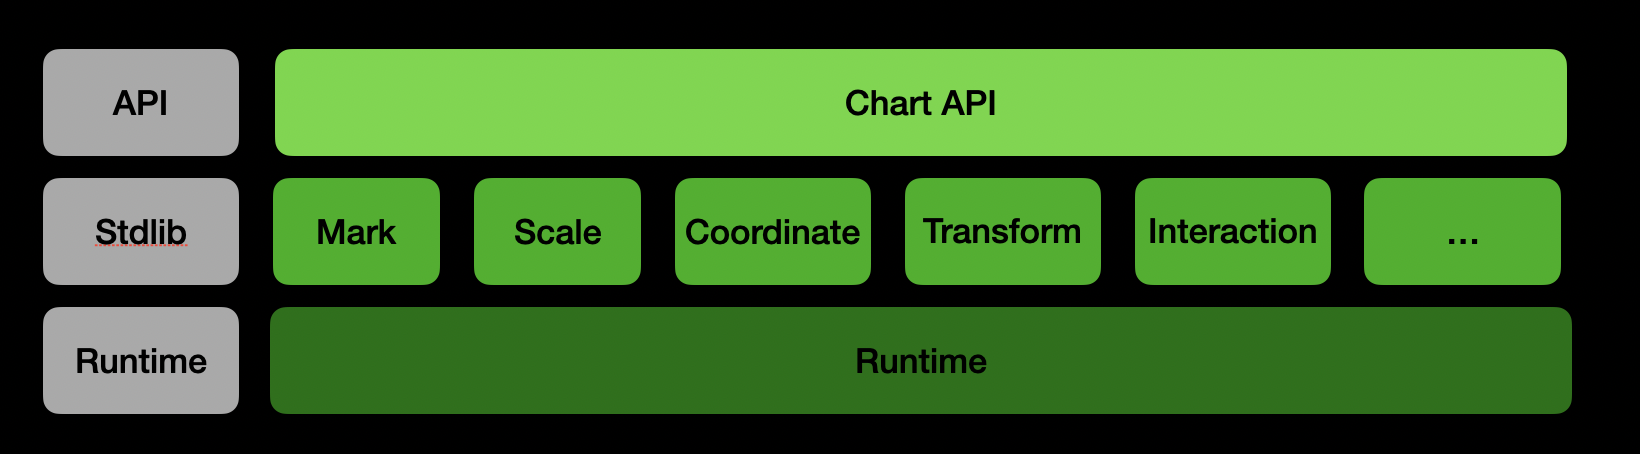
load on demand
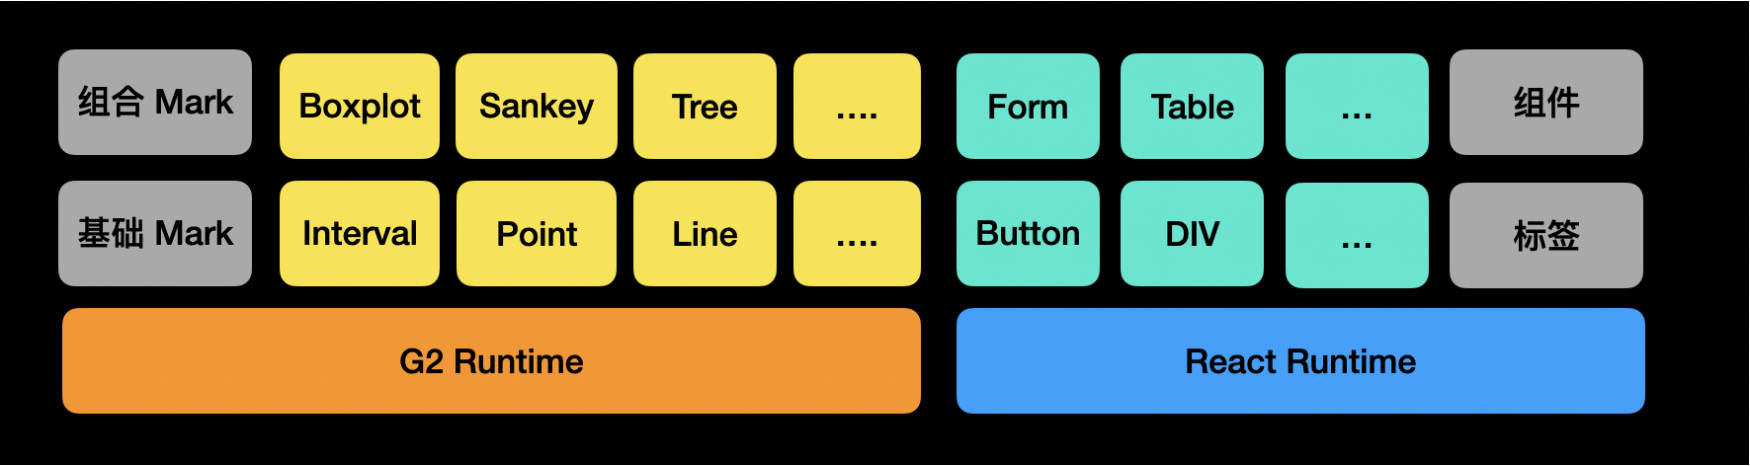
The core competencies of G2 5.0 are still passed ChartExposed, but the internal implementation has been completely rewritten, and has been decoupled into a collection of modules in the form of runtime + stdlib. The new architecture provides better maintainability for the source code, and lays a solid foundation for future on-demand packaging and reduced runtime volume. At the same time, these modules have similar function signatures, which can maintain a relatively unified mind when customizing.
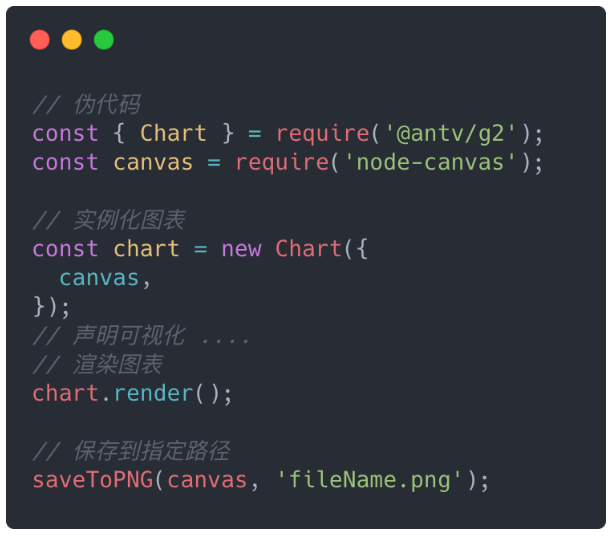
server-side rendering
G2 5.0 has the capability of server-side rendering. This also opens up more usage scenarios, such as embedding charts in an email or reporting system that automatically generates content on the server side. Unlike AnyChart or Highcharts, which is based on headless browser solutions like PhantomJS, it uses node-canvas, JSDOM and headless-gl that can run in the Node.js environment to provide support for different renderers.
Based on this capability, the development team removed Jest Electronand use Jest + Vite + Node Canvas Introduced integration tests. Among them, the preview environment built with Vite provides a more realistic browser preview environment than Jest Electron, and also brings a better development experience because of its fast response. You can directly test the screenshots of the visual charts in the preview environment, which not only improves the reliability and completeness of the test, but also greatly improves the efficiency of writing tests: there is no need to assert the internal data structure that may change, which is sustainable for G2 Integration provides solid support.
Staged release
The official said that the official release of G2 5.0 means that the framework is ready as a whole. Although some sub-modules of the framework need to be further adjusted and improved to reach a stable state (especially the internal interface design of the Mark and Shape modules), and will be unpacked to reduce the package size in the future, it is believed that G2 5.0 can be used to open a new project. The community is also encouraged to use the G2 4.0 library to plan an upgrade project to support G2 5.0.
next phase of work
For a period of time after release, the focus will be on:
- Adjust the internal interface to expose the customization capabilities of each module.
- Optimize visual effects, provide more theme styles and theme building tools.
- Implement new interaction specifications and design new interaction grammars.
- Improve Spec API, provide corresponding documents, cases and related tools.
- Optimize performance and ensure stable capabilities.
- Further complement tutorials and articles.
The G2 stack team will continue to maintain the v4 version, and release Patch version fixes for bugs, but will no longer accept new Feature Requests after that, and the deadline is the end of 2023.The original v4 official website migrated to https://g2-v4.antv.vision/.
how to upgrade
Because this is a brand new version, there is no low upgrade cost for existing projects. In order to reduce the upgrade cost of users as much as possible, the official has guaranteed the unification of most visualization concepts, and will also provide an upgrade document to point out some differences between the old and new versions. After the release of G2 5.0, it will also maintain a weekly version update rate.
“It is difficult to make a comprehensive upgrade decision, but there are indeed many existing problems and the old architecture is difficult or impossible to solve, and the historical burden has always hindered the further development of G2. Therefore, what we hope is that nothing can be broken and nothing can be built, and we also hope that the benefits brought by the upgrade can make everyone feel that the difficulties are worthwhile.“
#Data #visualization #engine #v50 #Spring #released