
Two-stage sorting (rough sorting-fine sorting) was originally a sorting framework proposed due to system performance problems. For a long time, the positioning of rough sorting has been a degraded version of fine sorting. However, we found that through some technical means, rough sorting can The collection goes beyond fine row.By re-examining the relationship between rough sorting and fine sorting, and proposing a new evaluation system called global hitrate, combined with sampling optimization, distillation and other means, we increased the turnover of the search market by about 1.0%.

▐ overview
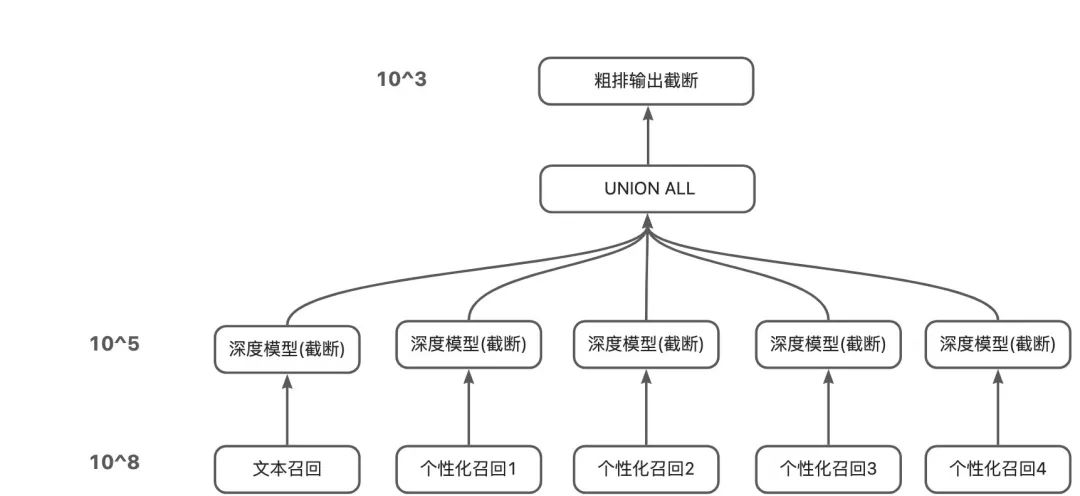
Taobao main search is a typical multi-stage retrieval system, which is mainly divided into recall, rough sorting, and fine sorting stages. In the recall stage, it is composed of multiple recalls such as text recall and personalization, and the output product level is about 10^5; in the rough sorting stage, it needs to be screened separately from the three-way recall set, and the selected 10^3 level is provided to the fine sorting ; Subsequent refinement and other stages will be screened and output about top10 for exposure to users. (Note: 10, 10^3, 10^5, etc. in the following all represent orders of magnitude, and the values are only for illustration, only their relative sizes have reference significance)
Last year, our team adopted the “three tricks” of multi-objective optimization + negative sample expansion + listwise distillation, and achieved remarkable results in the rough sorting stage of the main search. difference, and under the verification of the recall set hitrate in each way, it shows that the rough sorting model significantly exceeds the fine sorting model, but due to time reasons, we only made a relatively one-sided attempt. We have backtested all the improved functions and made further improvements and enhancements at the same time.
In terms of evaluation indicators, since last year we only had a one-sided indicator (NDCG) to measure the consistency with fine scheduling,Unable to measure recall-coarse row loss, and then it is impossible to measure the quality of negative sampling for rough sorting, and there is a big deviation between the goal of rough sorting and the actual optimization direction of rough sorting. worse. Therefore, this year introduces a brand new evaluation metric “global transaction hitrate“As the most important evaluation standard for rough sorting, and after a month of systematic analysis of the impact of the global transaction funnel loss from recall -> rough sorting -> fine sorting combined with different optimizations corresponding to online GMV, not only for this The effectiveness of the evaluation indicators has been tested, and the optimization space and optimization goals of each stage have been standardized and unified to a certain extent. At the same time, when it comes to the offline optimization goals of the rough sorting stage, the global hitrate needs to be further split. Among them, there are natural differences between before and after rough sorting, inside the scene and outside the scene, and finally we propose two types of evaluation indicators through analysis and verification to describe “Coarse row -> fine row loss“and”Recall -> Coarse row loss“After analysis and refinement, these rough evaluation indicators can finally have a strong positive correlation with online indicators.
exist”After the indicators of “rough sorting -> fine sorting loss” and “recall -> rough sorting loss” are established, we will find that we can use technical means to alleviate the two problems mentioned at the beginning, “inconsistent with the goal of fine sorting” and “The rough rehearsal sample space is inconsistent with the online scoring space” can be reflected in these two indicators respectively. Among them, the problem of long-tail commodities we only solved the problem of “over-scoring” last year, but actually aggravated the problem of “low-scoring”. Some attempts have also been made, and the specific methods will be elaborated in Section 4.
▐ Model infrastructure
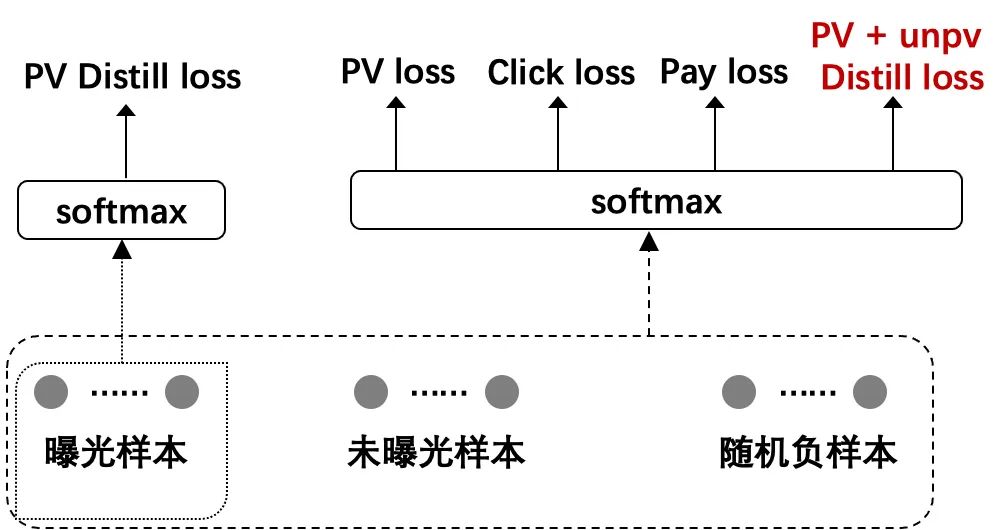
A list of , that is, the sample dimension is
,in

Denote the corresponding lengths of exposed samples, unexposed samples and random negative samples, respectively. Last year, this part of the sample construction work was only carried out through speculation and analysis. After the global transaction index was proposed and discovered this year, this part of the work was back-tested, and it was found that the two parts of the negative sample, the unexposed sample and the random negative sample, were expanded. Comes to about 5.5 pt out-of-scene hitrate boost.


In this section, we use the newly proposed global transaction hitrate indicator to analyze the search full-link funnel. Global transactions can be divided into two types of transaction samples: transaction within the scene and transaction outside the scene. In-scenario transactions refer to all transactions generated by users in search scenarios, and out-of-scene transactions refer to transactions generated in non-search scenarios associated with the same user. Since there is no query in the non-search scene, we use correlation as the association condition to associate the user’s transaction item outside the scene with the user’s query in the scene, and require the query-item composed of the query in the scene and the transaction item outside the scene satisfy certain correlation conditions.
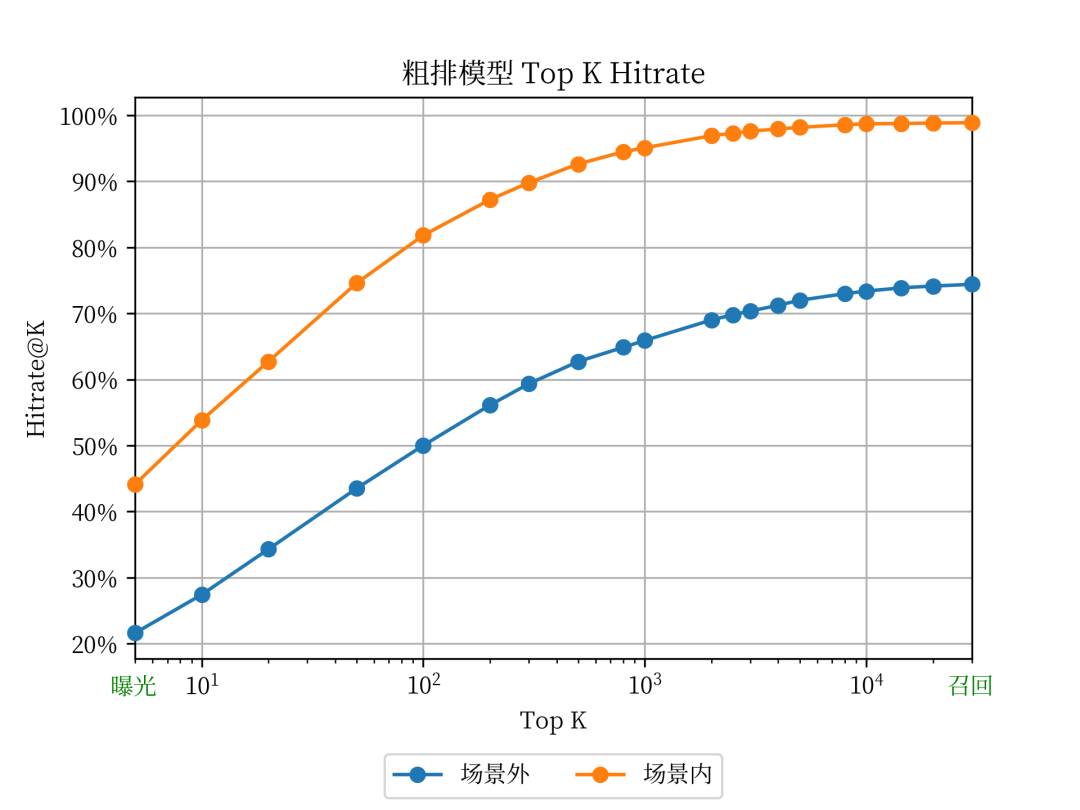
We attribute the scoring set in the rough sorting stage to the corresponding in-scene and off-scene transactions by way of burying points.Specifically, the multi-way recall results are uniformly sorted using the rough ranking model scoring, and the Top K calculation is truncatedSearch leads to dealand the relevantNon-search related transactionThe corresponding hitrate@K, see the figure below:

Analysis and Correction of Rough Sorting Offline Metrics
▐ Inspired by: Measuring coarse->finish loss
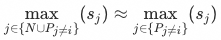
Coarse row hitrate@10 and other rough row headIn-scene transactions The goal of fine-tuning optimization is to select the best quality andCompatible with the search scenario bias (can be sold in the search scenario)Top 10, or even Top 1, so if the hitrate@10 predicted by the rough ranking can be improved and close to the transaction in the scene, it will naturally be more consistent with the fine ranking to a certain extent The NDCG/reversed pair of the rough sorting total score and the fine sorting efficiency score of exposed products This is an indicator that we have been using consistently in recent years. It pays more attention to the consistency with the refined layout, mainly in terms of model/features/targets and other aspects compared with the refined layout depth model. AUC Because in some cases the calculation of the above two indicators is too difficult, or sometimes in order to compare with the AUC indicator of fine sorting, we will calculate the AUC at the granularity of each request, because the loss function of the rough sorting model is based on the sorting loss of listwise Function, the absolute value of the final output score has no actual physical meaning, and the scores under different requests cannot be directly compared, so there is no way to calculate the Total AUC.
▐ Continuing: Measuring recall -> rough row loss
hitrate@10^3 in the scene
The hitrate of the rough sorting output set in the scene must be 100% in evaluation, and can only be approximated by a set that is less than an order of magnitude smaller than the rough sorting score. It can be specifically defined according to the scoring situation of different scenarios
off-scene hitrate@10^3
Since there is basically no bias in off-scenario transactions, it is necessary to use off-scene indicators as a benchmark to judge the ability of the rough sorting model.
▐ Consistency analysis of offline hitrate increase and hitrate increase in online A/B test
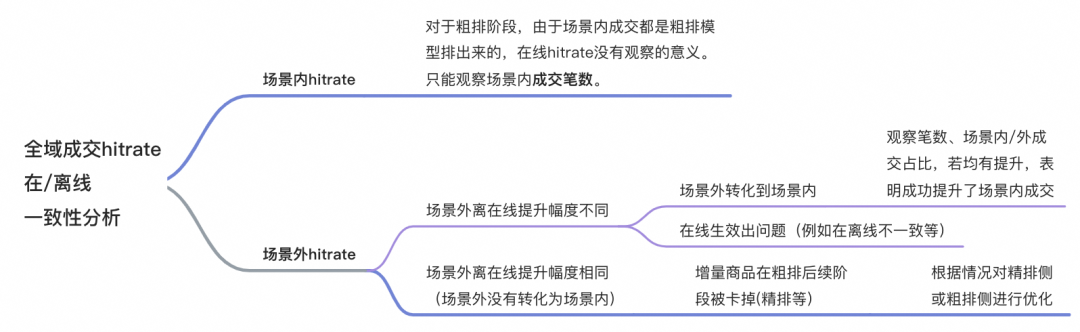
In the scene
The improvement range must be different from online:
Because after the rough sorting model goes online, the candidate set for fine sorting has obvious changes.
distribution shift
and then the absolute value of the final index must be different, so for the analysis in the scene, we can only look at the final number of transactions in the scene. As for the rough hitrate@10^3, it is not meaningful to observe after it goes online, because this part of the results The online itself is also determined by the fine arrangement.
outside the scene
off-line boost
different
:
Transformation from off-scene to in-scene: If the increase in off-scene transactions is transformed into in-scene transactions, the number of transactions in the scene and the ratio of in-scene to in-scene transactions will all increase significantly.Because after the out-of-scene is transformed into in-scene, the remaining out-of-scene transactions become more relevant to the current model.
“Disaster”
, so it is in line with expectations. So in this case, we have actually achieved our ultimate goal – to increase the transaction in the scene.
There is a problem with online validation: If the number of pens in the scene does not increase, and the increase outside the scene decreases, there is a high probability that there is a problem with online validation, which needs to be checked for specific problems. Common problems are offline features, model inconsistencies, etc.
outside the scene
Increase
same(
That is, outside the scene is not transformed into the scene):
Whether the hitrate is increased in the subsequent stage of rough sorting (fine sorting, etc.) outside the scene: If there is no hitrate increase in the subsequent stage itself, it means that the newly recalled products in rough sorting are not recognized in the subsequent stage of rough sorting, which may need to be determined from features/samples/loss Find the difference from the perspective of indicators,
It is necessary to decide whether to adjust the rough row or the fine row and other stages according to the specific situation.

Optimization
The optimization work is carried out on the basis of the model introduced in the chapter “Model Basic Structure”. According to the analysis results in the third section, the optimization of the model mainly includes two parts: the first is to reduce the loss of the products output in the rough sorting stage in the fine sorting stage, This part of the work mainly focuses on improving the ability of the rough sorting model, including model distillation, feature introduction, model structure enhancement, etc.; the second is to reduce the loss of recalled high-quality products in the rough sorting stage. This part of the work mainly focuses on samples Distribution optimization.
▐ Reduce rough-finish loss
Further Expansion of Distilled Samples

Distillation as an example, pctr = pctr * 1 =P(sea selection->click) can represent the probability from sea selection to click, but for unexposed products, its posterior P(sea selection->exposure)=0, from From a mathematical point of view, pctr cannot be multiplied by 0 or directly represent the probability of audition to click. For the above two problems, we found that since the exposure set is in top10, the unexposed sampling set is random from 10 to 5000, which is usually significantly smaller than the exposure product rating, and the problems in (i) can be ignored. One of the solutions to problem (ii) is to use the label smoothing method to use pctr * scale instead of pctr * 0 to preserve the gradient, where scale << 1.
+0.65pt
; In addition, hitrate outside the scene also has
+0.3pt
The improvement of , indicating that the model ability can also be improved after introducing more refined scores.
Further Aligning Coarse and Fine Features
▐ Reducing recall-roughing loss
In Section III, we mention the new metrics introduced by Coarse Ranking this year:global transaction hitrate. The global transaction hitrate can reduce the bias in the evaluation index and evaluate the ability of the model more objectively. In order to directly optimize this indicator, we start from the sample point of view and introduce samples from outside the scene (that is, Taobao transactions other than the search scene) into the training samples, so as to improve the performance of the model on hitrate.
We introduce out-of-scene samples by correcting positive samples. In the original samples, there are two possibilities for out-of-scene samples: one is to be used as a negative sample of the transaction task; the other is not to exist in the sample set (because the out-of-scene samples may not have been exposed, or may not even be recalled). In order not to destroy the original distribution of training samples, we first try not to introduce new samples. In this method, if a certain sample exists in the original sample, its deal label is set to 1. Experiments show that such a sample correction method has almost no impact on the hitrate in the rough sorting stage. Through further analysis, we found that if the out-of-scene transaction samples appear in the original samples, they are almost only likely to appear in the exposed samples, and rarely appear in the unexposed samples or random negative samples. In this way, such a sample correction method is actually a correction of exposed samples, that is, the samples that have been exposed but have been traded outside the scene are corrected from negative samples to positive samples. It should be pointed out that,The exposure samples are actually the samples discharged by the rough sorting modelthat is, even if this part of the sample is a negative transaction sample, the score is already relatively high for the rough sorting model (because it is a positive sample of the exposure task),The transaction/click label correction of this part of samples in the exposure stage will not bring benefits in the rough sorting stage. Therefore, if you want to increase the off-scene transaction hitrate in the rough sorting stage, you must introduce more off-scene samples that were not discharged in the rough sorting stage.
Based on the above analysis, we further introduce out-of-scenario transaction samples. On the basis of correcting the original samples, we add the out-of-scene transaction samples that do not exist in the original samples to the exposure samples, and set them as positive examples of the exposure, click and transaction tasks at the same time. In this way, we increased the sample size of the transaction sample by about 80%.After the samples are amplified, the hitrate outside the scene of the rough row model is improved0.6pt.

,in

Indicates the number of impressions corresponding to the product history. After adjusting the sampling method, the proportion of long-tail products has changed significantly:
▐ Other optimization work
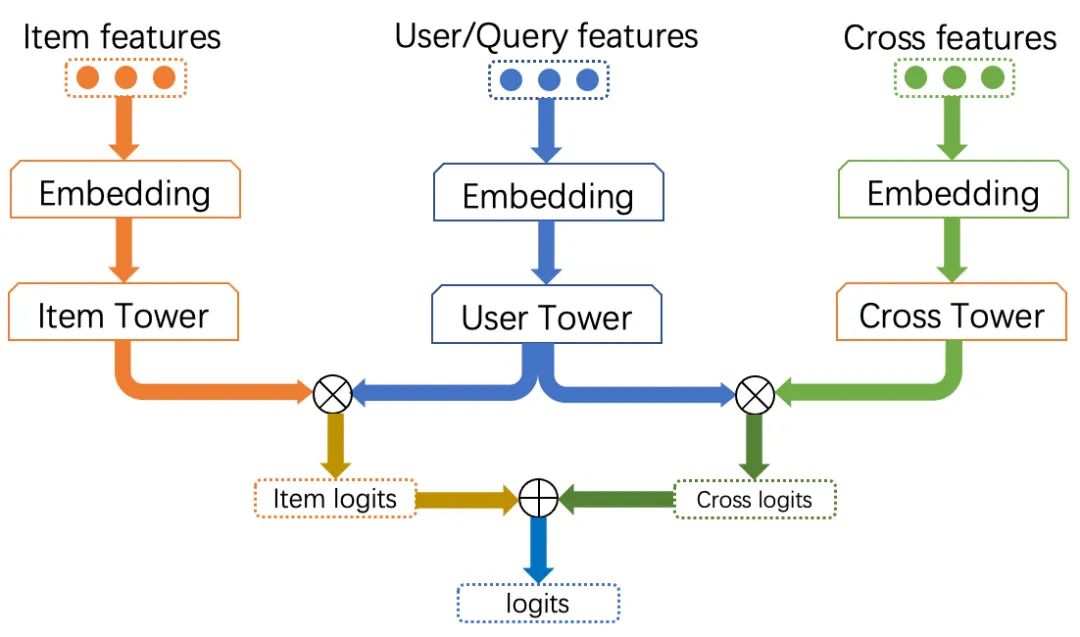
Formal optimization of the loss function

Indicates the inner product of the item side and user side vectors, that is, similarity;

Indicates the length of the list. Different from the tasks in other scenarios, the three tasks of the rough model, especially the exposure task, in each list,
just like
The number of books may not be 1(Especially for exposure tasks, the number of positive samples is usually 10). We found that in the scenario of rough sorting, it is unreasonable to directly apply the optimization objective of softmax in the case of multiple positive samples, and accordingly improved the loss function to make it more suitable for the optimization goal of the rough sorting model .
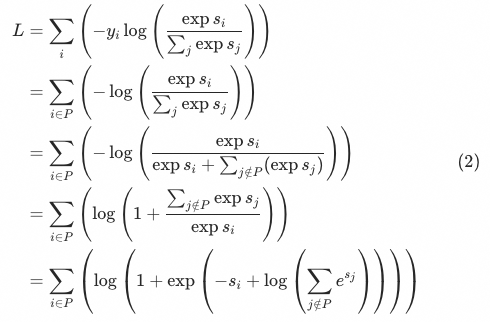

Represents the set of negative samples,

Indicates except

Positive sample set other than samples

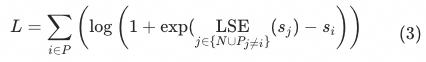
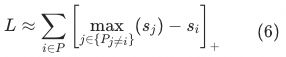
(also known as the SmoothReLU function) is approximated by ReLU:

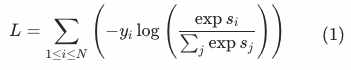
the above loss functions are trying to enlarge the positive sample
The distance between the upper bounds of all other samples in the current list, where “other samples” include all negative samples,
Also includes except sample
Other positive samples other than
.In most cases, the inner product similarity of positive samples is greater than that of negative samples, that is
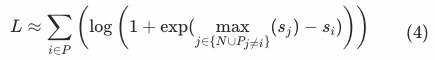
so formula (5) can be further written as:

and divide
The upper bound of all positive samples other than
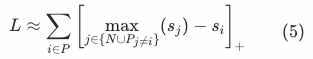
The final effect is to increase the distance between positive samples, while ignoring the really important difference between positive samples and negative samples.
Once the problem with the current softmax function is understood, the problems found above can be avoided by slightly modifying the above formula.Specifically, in formula (5), we only need to dividePositive samples other than item is deleted, that is, the calculationcurrent sampleand divideThe upper bound of all negative samples other than:
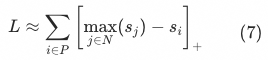
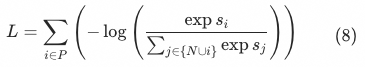
Smoothly expand Equation (7) back to softmax.Correspondingly, only the current sample in the denominator needs to beAll other positive samples can be eliminated:
Adjustment of precise layout and printing weight based on global analysis

Compared with the previous coarse sorting version that only used fine sorting samples in the industry, the optimization of sampling methods for business scenarios, multi-objective loss fusion, and distillation methods proposed by Main Search since last year has brought a total of about 1.0% of the search market. transaction value increased.It should be pointed out that we treat the coarse->fine loss and the recall->coarse loss equally. However, from the recent offline experiments, it can be seen that most of the experiments will have two situations: one is that the offline hitrate does not increase significantly, that is, the optimization point has no effect; The row loss increases, that is, the output set of the rough row does become more high-quality, but the incremental part cannot be recognized by the fine row (or only a small part is recognized). This is actually in line with cognition to a certain extent. For example, many changes in rough sorting, such as the introduction of global samples associated with positive samples that have not been fine sorted, and changes in the distribution of random sampling samples for negative samples, are not currently available in the current experiments of fine sorting. Adding similar positive and negative samples, it is difficult to correctly score a high-quality collection of coarse increments. Therefore, the optimization of the subsequent rough sorting should not only follow the optimization of the losses of the upper part and the lower part. For the high-quality products that failed the fine sorting found in the analysis and verification, the samples of the rough sorting and fine sorting should be carried out to a certain extent according to specific problems. Alignment, cooperate with the waist sorting ability of the rough sorting and the head sorting ability of the fine sorting, and at the same time increase the consistency to a certain extent, and finally achieve a win-win situation.
Extended reading
¤
3DXR technology
|
terminal technology
|
audio and video technology
server technology
|
technical quality
|
data algorithm
This article is shared from the WeChat public account – Big Taobao Technology (AlibabaMTT).
If there is any infringement, please contact support@oschina.cn to delete it.
This article participates in the “OSC Source Creation Project”, and you are welcome to join in and share it together.
#optimization #practice #indepth #unified #rough #ranking #Taobaos #main #search #Personal #Space #Big #Taobao #Technology #News Fast Delivery